

MiDFUN Product Module / VH
Vickers hardness testing for materials quality control
VH supports hardness testing and materials inspection where test conditions, measurement results, and quality evidence must be recorded consistently.
Best Fit
- Vickers hardness measurement
- Materials testing and quality evidence
- Lab inspection result management
Key Capabilities
- Hardness test result capture
- Measurement condition and record management
- Report-ready materials inspection evidence
QRP Data Flow
VH converts materials test results into controlled records for quality review and customer documentation.


Automatic Image Measurement
Rapidly measure Vickers (Vicker) hardness using computer imaging, with a choice of automatic or manual operating modes that reduce human parallax error and improve measurement efficiency, accurately and efficiently detecting the hardness value automatically within 0.2 seconds.
- High image-recognition rate; even for complex structures, it reads quickly, calculates the indentation area, and automatically computes the HV value with an error within 1%.
- High repeatability; each re-inspection is within 1 pixel (1PIXES), delivering high reliability.
- Material-structure images can be saved and recalled at any time for measurement or printing.
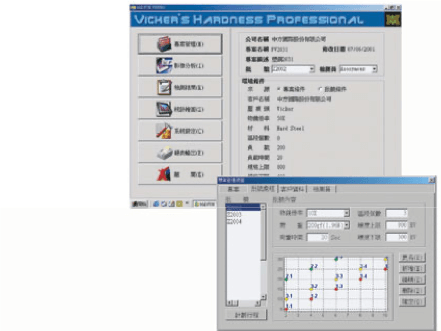
Project-Based Management for Convenient Data Search and Integration
Organize different customers into projects and file records by batch number, enabling effective historical-data search and analysis, and making the integration and printing of analysis reports more convenient and easier to understand.
Material Hardness Unit Conversion
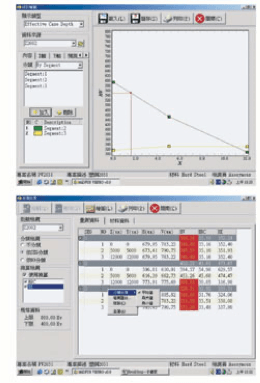
Built-in commonly used hardness conversion tables, with a function for users to expand them on their own, let you convert between various hardness indices — HRA, HRB, HRC, HRD, HV, HR, TS, HBS, HBW — eliminating the time and effort of manual table look-ups.
Multi-Hardening-Curve Graphical Analysis
Cross-comparison analysis makes it easier to understand the characteristic variations of each measured test piece.
It can predict not just a single hardening point or hardness value, but also the effective hardened layer.
Flexible Report Output
Report formats can be customized; data, analysis charts, and images can be imported into Microsoft Word for report output, with self-defined print formats that can be varied into hundreds of preferred print layouts.
SPC Statistical Analysis Function
Plots statistical process curves for the measurements, including practical analysis functions such as XBAR-R, histogram, XBAR-S, X-RM, UCL, LCL, CL, Ca, Cp, Cpk, Pp, Ppk, and more.