CT Push-Pull Force, Electrical & Laser Parametric Measurement System
System Function Overview
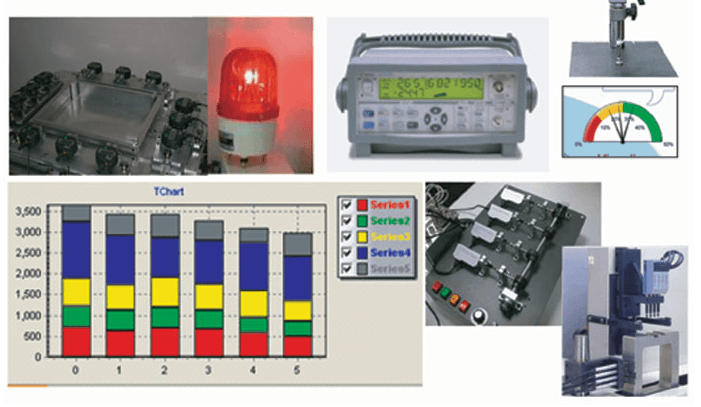
CT monitors the measurement data captured during continuous inspection and determines whether it falls within tolerance. The results can be displayed instantly in a simple form using a high/low water-level chart or a needle (gauge) chart—for example, when inspecting workpiece thickness on a production line—and a nonconforming reading can automatically trigger an alarm.
Data Display Screen:
Synchronously displays multiple data inputs on one screen and instantly provides professional metrology and counting control charts: Histogram, X-bar & R, X-bar & S, X-RM (Individual & Moving Range), Scatter Diagram, Combined Process Chart, CUSUM, EWMA, Short-Run, Box Chart, Normal Distribution Chart, Process Capability Trend Chart, p, np, c, u, Pareto Chart, Defect Trend Chart, Cost Analysis Chart, and Stratification Analysis Chart.
Statistical Parameters:
Max, Min, Ave, Std, Dev, UCL, CL, LCL, Ca, Cp, Cpk, Ppk, PR, CR, Cau, Cc, Cal, USL, SL, LSL—more than sixty types of charts and indicators in total, meeting every customer requirement.
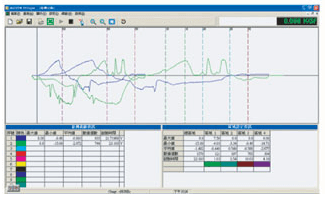
Observes the interval variation of continuous inspection data and plots a continuous trend line. It can independently capture the highest peak value, the lowest valley value, and the curvature change within a selected time interval, and can connect to an SPC database or other software databases for further analysis.
Continuous Trend Chart:
Can display multiple signal curves, takes the PEAK and VALLEY values within an interval, and automatically calculates the minimum, maximum, and average values while recording the start and end times.
NG Monitoring Chart:
Provides a direct monitoring chart system for data acquired at fixed intervals or data that has been processed by machining calculations, making on-site inspection management convenient.
Stopwatch Needle (Gauge) Chart:
Sets the upper and lower tolerances (green zone), the manual upper and lower control limits (orange zone), and the out-of-control range (red zone). The gauge is color-zoned with left-right symmetry.
Water-Level Tolerance Chart:
For equipment such as micrometers and air gauges, it compares multiple dimensions simultaneously to check whether each measured dimension is within tolerance, replacing the conventional method of monitoring on the original display. The graphic shows an upper water-level chart, with numeric values below and a two-layer display of any of the Man–Machine–Material–Method factors.
Automatic Control:
Can command equipment to start up automatically with the relevant preset rated voltage—for example, a current supply unit—and can also control a motor or encoder to stretch the workpiece, as in a push-pull force gauge, calculating the force-versus-position chart or the force-versus-time chart.
Laser Diameter Gauge:
Measures the circular diameter or thickness of a workpiece, records the measured value, and directly displays whether it is conforming.
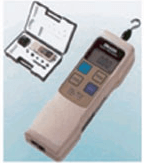
Push-Pull Force Gauge:
Plots the force-versus-position or force-versus-time curve. For a destructive measurement, it takes the breaking point (i.e., the inflection point of the curvature); for a non-destructive, repeated measurement, it observes the variation in the curve.
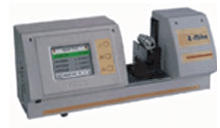
Micrometer:
Applied to contact-type inspection of the width and thickness of production workpieces, or of multiple dimensions in a single operation. It can perform inspection offline or in real time on the production line and determine whether the part is conforming, providing an automatic warning function on an NG result.
Capacitance, Resistance, and Power Testing:
1. Automotive power-window startup maximum-current test: experimentally determines the minimum current value required for the product function to operate and start up.
2. Capacitor destructive test: tests the maximum voltage or current limit that the capacitance among the electrical characteristics of the device under test can withstand.
Electronic Micrometer and Air Gauge:
Synchronously inputs signals from multiple instruments and processes the data for interpretation, enabling fast on-line inspection with real-time graphical monitoring—for example, the roundness of a round bar or an automotive bearing.

 Observes the interval variation of continuous inspection data and plots a continuous trend line. It can independently capture the highest peak value, the lowest valley value, and the curvature change within a selected time interval, and can connect to an SPC database or other software databases for further analysis.