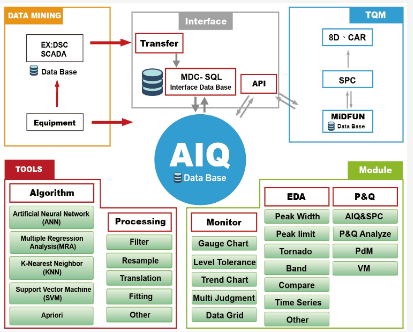
AIQ AI-Powered Intelligent Quality System | Smart Manufacturing Quality Analytics
Application example: temperature-rise, pressure, and molecular-weight curve analysis
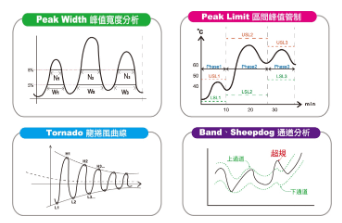
In chemical tanks and reactors, properties such as temperature, pressure, and molecular weight produce trending curves over time in sequence. The chemical industry frequently uses DCS or SCADA systems—such as Honeywell PHD or Yokogawa—to collect inspection data. Through the AIQ software you can connect to the DCS database; once the data is loaded, you can pre-process the numerical data to select suitable values and fit them into a curve, then apply controls to each node, slope, and inflection point. By interpreting how these change, you can identify the events that occurred during the chemical reaction—for example, pinpointing the moment a solvent was added—and then select the value changes in that time domain to apply upper/lower limits or custom-rule control. Out-of-spec anomalies can also be pushed to the relevant personnel via email or warning light.
Numerical database system integration & data mining
Convert equipment inspection data into a standard protocol format and, through system integration, develop advanced database applications. (For example, use Honeywell’s .NET Wrapper or the Microsoft OLEDB Provider Driver to retrieve measurement data from the PHD Server and forward it to a data-analytics database, performing a preliminary consolidation step first, organized by the analysis categories required.)
Numerical pre-processing — Processing
Filter
Screen the data by configured conditions, removing unsuitable values and selecting valid values with a stable trend for further processing.
Resample
Based on the characteristics of the value curve, change the sampling content of the data to obtain representative figures without altering the curve’s original characteristics, reducing wasted storage space and computation time downstream.
Translation
Using methods such as Fourier transform (FFT), logarithmic (Log), exponential, polar coordinates, and normalization, convert the data in a given time domain into other values for meaningful analysis.
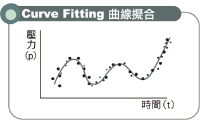
Curve Fitting
If the data contains one-dimensional input and output, a mathematical model (linear, quadratic, cubic, etc.) can fit a curve from multiple data points for subsequent analysis.
MiDFUN’s professional R&D team accepts your plant’s special customization requirements, advancing and optimizing system functions to meet your practical needs.
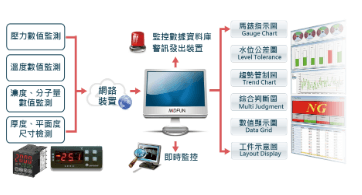
Real-time numerical monitoring module — Monitor
Applicable to online inspection of single-point, multi-point, and linked numerical monitoring
1. Automated connection of production inspection instrument values.
2. Real-time display of values, interpreting workpieces as OK or NG through user-defined control rules.
3. Real-time alerts for abnormal values: beyond on-screen software warnings, an external warning light or e-mail message can be triggered, with complete logging of abnormality messages.
4. Integrate with sorting machines to classify good and defective parts, or halt the machine on consecutive anomalies.
5. Can be built into machine-zone, plant-wide, and even cross-site central monitoring. Can be made into a display dashboard and supports mobile devices.
Process-parameter and quality-inspection data integration — Integration —— diverse thematic applications for smart manufacturing
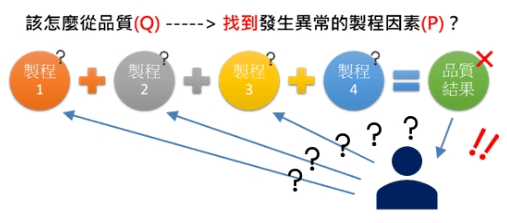
From quality results, run cross-station analysis to find abnormal process points and linked numerical monitoring
The problem: in the past, when an anomaly produced defective parts, the time lag often made it impossible to quickly trace the cause of the anomaly and correct the faulty process, leading to cost losses. Worse still, this becomes a vicious cycle.
The solution: when SPC inspection detects a quality anomaly, AIQ can use associations such as work orders and lot numbers to link to the corresponding product’s process-parameter history, letting you quickly review all process parameters across the manufacturing journey. Through correlation analysis, you can immediately narrow down the problem and pinpoint the abnormal process. The automated system can verify in real time whether a hypothesis is correct, so that failures no longer recur.
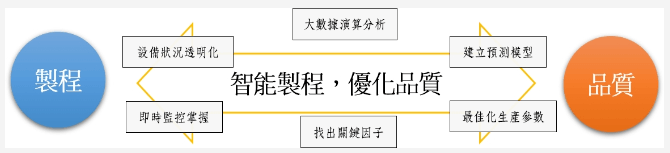
Identify the key process factors that most affect quality
Among the many process stations, big-data analysis of process parameters and quality-inspection data can correlate the degree to which each process parameter influences quality results, identifying the key process factors that most affect quality.
Predictive equipment maintenance
Define the equipment’s key components, accumulate data on key parameters, and monitor health trends through a predictive model to understand equipment health status and judge whether to replace a component. Replacement timing can be flexibly adjusted, saving components and avoiding unexpected downtime and breakdowns.
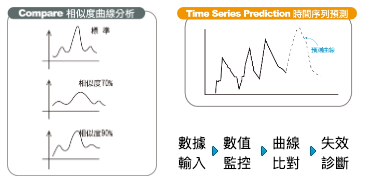
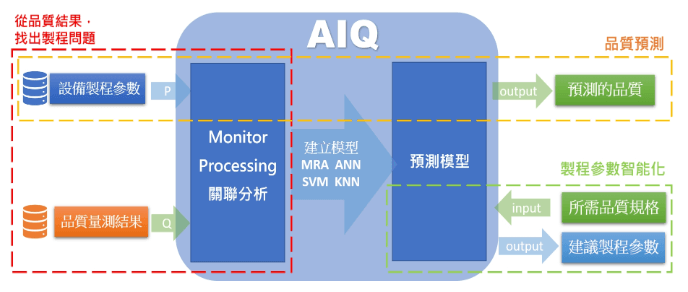
Quality prediction
When a product requires destructive measurement or cannot be measured, you can monitor process parameters to predict product quality in a timely manner. Ahead of the actual quality inspection, a predictive model lets you detect—and even prevent—quality anomalies early, also avoiding defective parts flowing to downstream processes and wasting capacity.
Identify the key process factors that most affect quality
Among the many process stations, big-data analysis of process parameters and quality-inspection data can correlate the degree to which each process parameter influences quality results, identifying the key process factors that most affect quality.
Monitoring and screening of full-inspection quality data
The problem: customers require 100% quality inspection of products, but faced with massive data that cannot be processed effectively or readily applied, what should you do?
The solution: AIQ can perform real-time monitoring, control alarms, and simple statistical charting on the big-data raw data of full quality inspection. Through AIQ’s data pre-processing capability, it can also screen out the data you need and upload it to SPC for back-end analysis and management applications.
Connect to SPC for back-end analysis and management applications
Across an entire plant, only a few key stations may perform 100% quality inspection. You can use AIQ as a front-end application, select the data required, and link that data to SPC to integrate it into the plant-wide quality analysis and management system. Using your existing SPC system and familiar analysis practices, you can carry out advanced analysis and produce a wide variety of rich reports—turning big data that previously could not be properly handled into a new path that can be applied effectively.
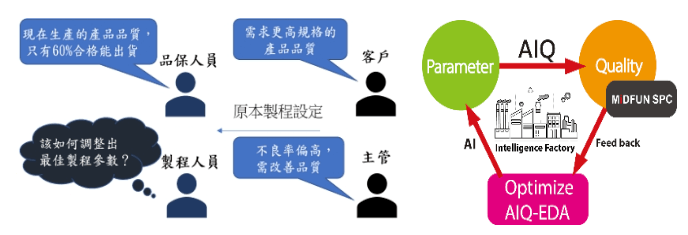
The problem: when customers demand better product quality, you select only the prime band within the quality range the line originally produces (for example, tightening a quality-control item’s inner diameter from 110–80 mm to 100–90 mm). How do you work out the adjustments, and rapidly adjust the line’s process parameters?
The solution: AIQ collects process parameters from each station and SPC quality-inspection data and runs correlation analysis, building a quality-prediction model through big-data algorithms. Afterward, you only need to input the desired target quality into the prediction model, and it intelligently derives recommended values for the optimal process parameters to use in production.
AIQ is a highly intelligent yet easy-to-use system that frees you from heavy reliance on human experience—using the most authentic scientific data to accumulate production intelligence for your enterprise and improve product quality. The AIQ AI-Powered Intelligent Quality System lets you adopt and apply it step by step. Matching the different needs of each stage, it opens up a variety of big-data application themes in a modular way. And with a professional technical team, customized applications can be tailor-developed for you.