Author: Pei-Chi Chiu | MiDFUN
SPC Statistical Process Control
AIAG-VDA
IATF 16949
📌 About This Article
This article is written by MiDFUN quality consultant Pei-Chi Chiu, providing an in-depth analysis of the first harmonized Statistical Process Control (SPC) Manual Yellow Volume draft (Stakeholder Review) released for industry review by AIAG and VDA in 2026. The article covers the core philosophical transformation of the new SPC manual, the risk-driven definition of special characteristics, the quality control loop architecture, advanced control chart selection, and how the MiDFUN SPC Statistical Process Control system enables intelligent AISPC applications to help the automotive supply chain meet IATF 16949 compliance requirements.
The New AIAG-VDA SPC Yellow Volume: A Milestone for the Global Automotive Industry
In February 2026, the global automotive industry welcomed a milestone change: AIAG (Automotive Industry Action Group) and VDA (German Association of the Automotive Industry) released the first harmonized Statistical Process Control (SPC) Manual Yellow Volume draft (Stakeholder Review) for industry review. The strategic significance of this “Harmonization” goes far beyond unifying document formats—it represents global automotive quality management standards moving toward a more consistent statistical process control framework. Final compliance requirements should still be governed by the subsequent official Red Volume, IATF 16949, and each customer’s CSR.
Core Philosophy: The Business-Logic Shift from Prevention over Detection
The core spirit of the new AIAG-VDA SPC manual lies in pulling enterprises out of the quagmire of “Reactive Detection” and driving them toward “Proactive Prevention.”
Traditional Quality Control (QC) focuses on screening finished products, which is essentially an “after-the-fact reckoning” of waste. Modern Quality Assurance (QA), by contrast, requires enterprises to achieve prevention through a deep understanding of process variation before defects occur. This is precisely the core philosophy emphasized by the MiDFUN SPC Statistical Process Control system: using real-time data monitoring and intelligent analysis to transform the manufacturing floor from “handling problems after they happen” to “intercepting problems before they occur.”
Long-Term Impact Analysis: Detection Strategy vs. Prevention Strategy
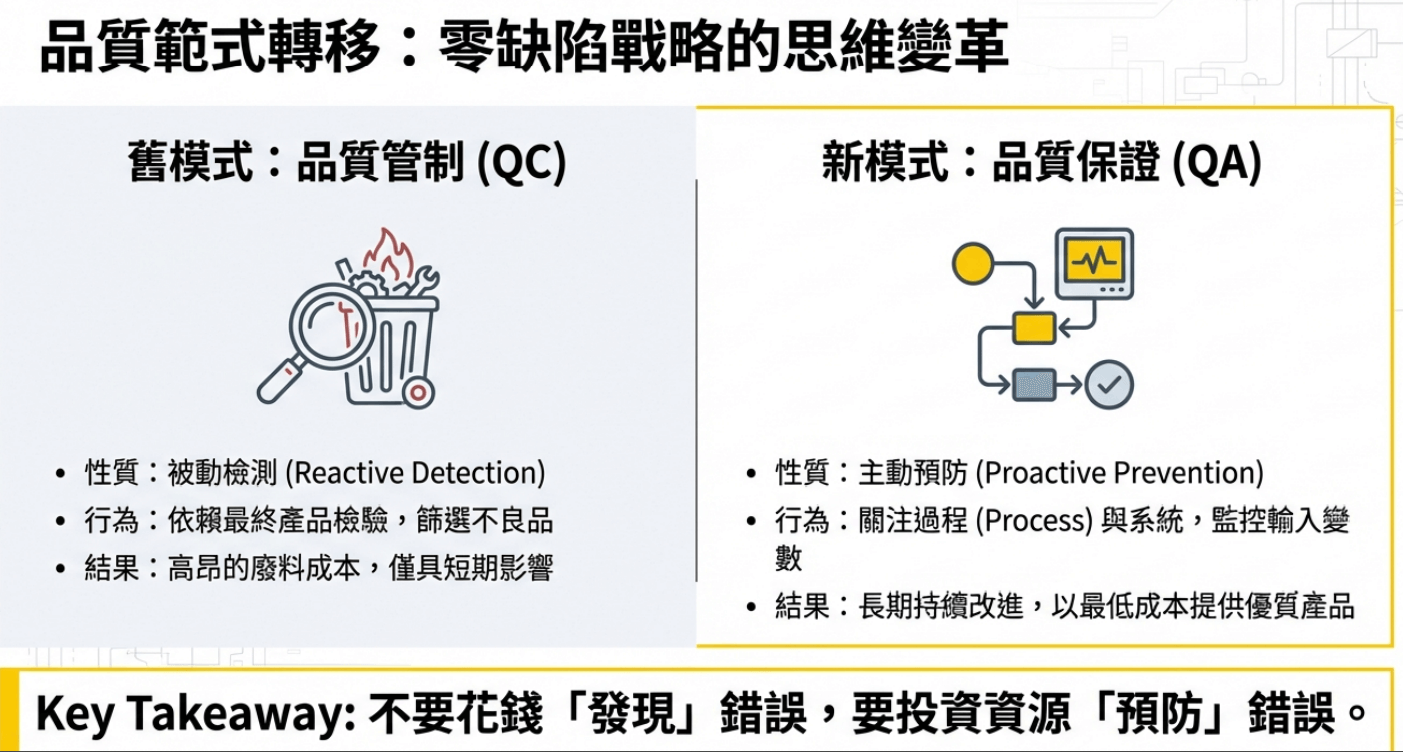
▲ Quality paradigm shift: the mindset change from QC reactive detection to QA proactive prevention (Source: AIAG-VDA SPC Manual)
The new manual systematically explains the long-term differences between the two strategies. Organizations that adopt a detection strategy often fall into a continuous cycle of quality costs, whereas enterprises that introduce preventive SPC statistical process control can significantly reduce internal failure cost while improving overall process capability indices (Cpk/Ppk).
Risk-Driven Definition of Special Characteristics
The new manual clearly states that organizations must recognize that “not all characteristics require SPC.” Resources must be deployed based on risk analysis, establishing a logical chain between FMEA (Failure Mode and Effects Analysis) and SPC. This is precisely why the integrated application of the MiDFUN FMEA Failure Mode and Effects Analysis system and the MiDFUN SPC system is especially important in the automotive component and automotive electronics industries.
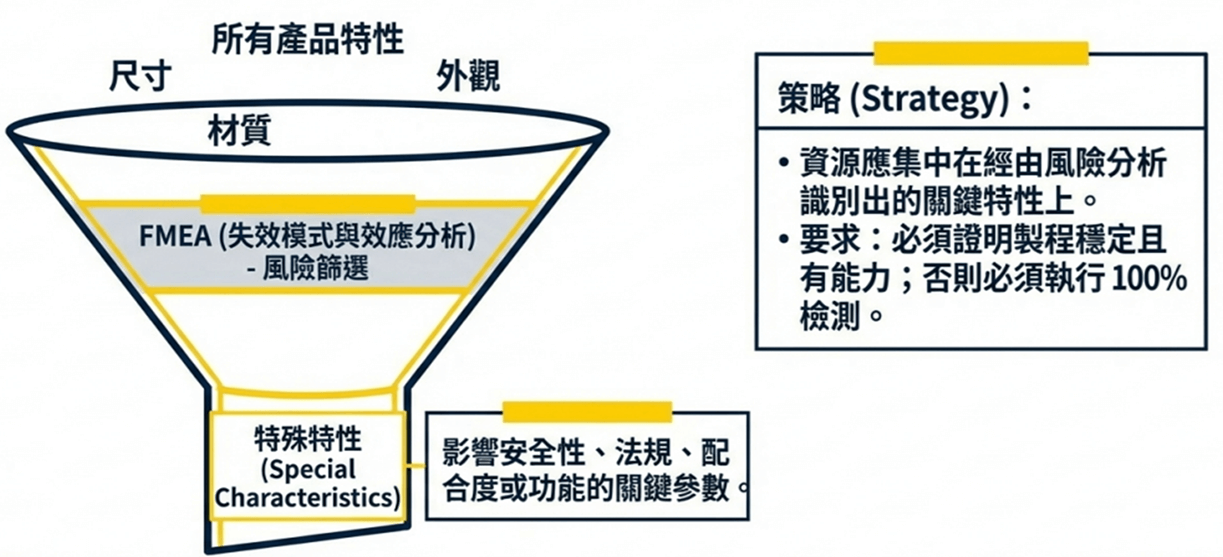
▲ FMEA risk screening funnel: resources should be concentrated on the key special characteristics identified through risk analysis (Source: AIAG-VDA SPC Manual)
The Core Role of Risk Analysis (FMEA) in SPC
According to manual §6.2.2 and Figure 6-1 (SPC preparation diagram), the identification of special characteristics (SC/CC) is a dynamic process flowing from risk analysis to the production and inspection plan. The high-risk items evaluated by Failure Mode Analysis (FMEA) are the prerequisite for determining the “control strategy” and the “sampling plan.”
Implementing the New SPC Practices and Steps
To ensure precise resource deployment, organizations should follow the process below in accordance with the new AIAG-VDA SPC manual:
Step 1: Failure Mode Identification—evaluate severity (S) and occurrence (O) through FMEA.
Step 2: Special Characteristic Selection—define the key parameters that affect product safety, laws and regulations, or customer function as special characteristics.
Step 3: Control Strategy Development—special characteristics must be bound to their corresponding control chart type, with a strict sampling frequency set.
Step 4: Transfer into the Control Plan—ensure that special characteristics are fully transferred from the FMEA to the Control Plan, serving as the regulatory basis for on-site SPC monitoring.
Roles, Responsibilities, and Competency Building in Statistical Process Management
The long-term effectiveness of a statistical management system depends on cross-functional collaboration. AIAG-VDA SPC manual §6.8 clearly states that SPC statistical process control is the responsibility of the entire organization, not borne by the quality department alone.
Responsibility Allocation of Key Roles Across the Six Quality Control Loops
Referring to manual §5.4 and Figure 5-3, the responsibilities of each department within the quality control loops are as follows:
| Responsible Department | Core Responsibilities | Key Control Loops |
|---|---|---|
| Production | On-site data recording, real-time monitoring charts, and responsibility for controlling “quality consistency.” | Loop 1 (SPC monitoring), Loop 2 (consistency) |
| Process Engineering | Analyzing sources of variation, jointly assessing stability with the quality department, and implementing improvements to the fundamental process elements. | Loop 3 (process improvement) |
| Quality | Validating the measurement system, collaborating with engineering to assess capability indices, and performing internal and external audits. | Loop 3 (collaborative assessment), Loops 4/5/6 (audits) |
The quality control loops ensure the precise flow of information from frontline operations to senior decision-making. They constitute the organization’s continuous improvement system, ensuring that the “Voice of the Process” can be interpreted in a timely manner and translated into “management action.”
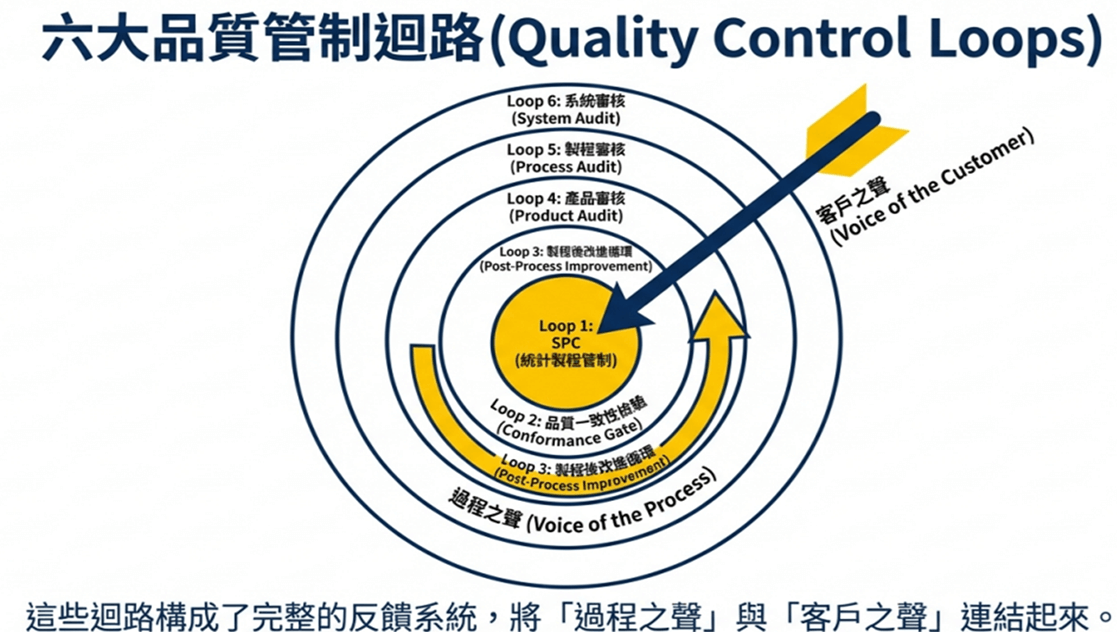
▲ The six Quality Control Loops: linking the “Voice of the Process” with the “Voice of the Customer” (Source: AIAG-VDA SPC Manual §5.4)
In-Depth Analysis of the Six Quality Control Loops
According to the new AIAG-VDA SPC manual §5.4 and Figures 5-3, 5-4, organizations should establish the following control structure:
| Loop Name | Core Objective | Responsible Department | Specific PDCA Application |
|---|---|---|---|
| Loop 1: SPC | Keep the process stable and in control | Production | Voice of the Process: P-reaction plan; D-on-site monitoring; C-alarm triggering; A-anomaly elimination. |
| Loop 2: Quality Gate | Ensure output meets standards | Production | Voice of the Customer (internal): perform conformity determination, reject nonconforming products and trigger corrective action. |
| Loop 3: Process Improvement | Reduce variation, improve capability | Quality/Engineering | Voice of the Customer (external): long-term performance evaluation, optimizing 5M1E to reduce process dispersion. |
| Loop 4: Product Audit | Verify conformity to product specifications | Auditor | Check: simulate the customer’s perspective by conducting random sampling and performance testing. |
| Loop 5: Process Audit | Verify the effectiveness of parameter management | Auditor | Act/Plan: check whether the work instructions and 5M1E conditions are implemented. |
| Loop 6: System Audit | Assess the effectiveness of the QM system | Auditor | Plan: management reallocates resources to ensure the SPC culture is put into practice. |
Statistical Competency-Building Matrix (Manual §6.8.2)
The new AIAG-VDA SPC manual points out that the competency of implementation personnel should be divided into two major domains:
Statistical Tech: understanding random causes and special causes, and having the ability to interpret out-of-control signals (such as the rules in §10.2.2).
Process Knowledge: understanding the physical impact of parameter adjustments on results, and being able to execute an effective reaction plan when an out-of-control signal is triggered.
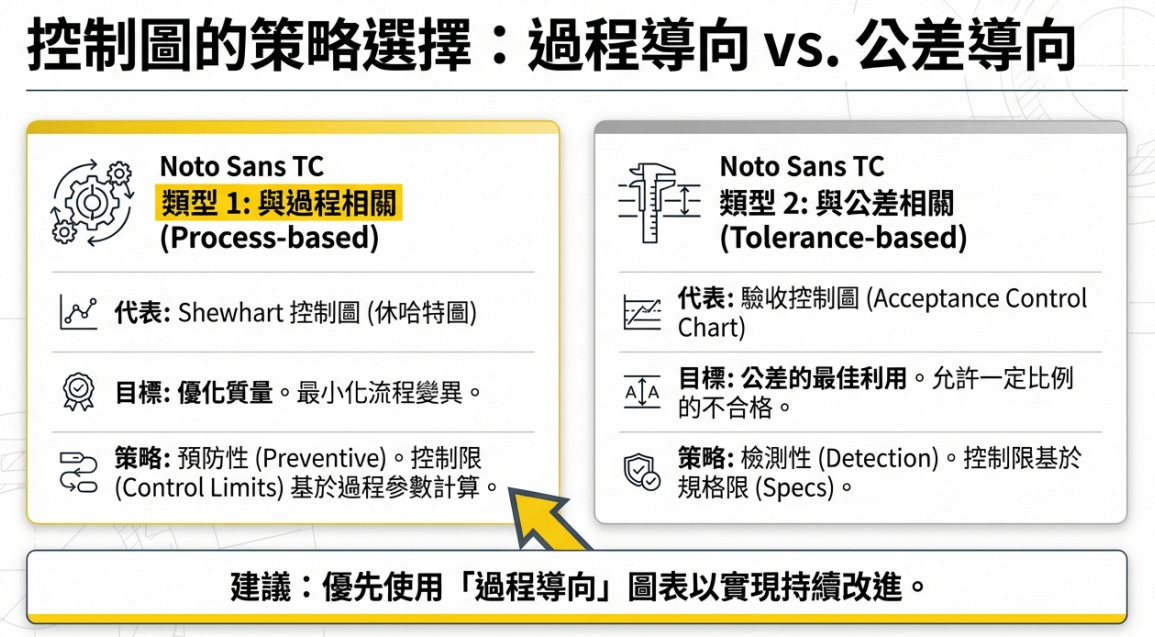
▲ Strategic selection of control charts: process-oriented (Shewhart control chart) vs. tolerance-oriented (acceptance control chart); process-oriented charts are recommended first to achieve continuous improvement
In-Depth Methodology: From Small Batches to Advanced Control Chart Selection
In a variable manufacturing environment, selecting highly sensitive statistical tools is the key to detecting small variations. The new AIAG-VDA SPC manual provides more comprehensive guidance on control chart selection.
Technical Application of Special Control Charts (Manual §10.3.5)
EWMA (Exponentially Weighted Moving Average) and CUSUM (Cumulative Sum) control charts: compared with the “memoryless” nature of the traditional Shewhart control chart, these two chart types possess a “Memory” function. According to manual §10.3.5.4 and §10.3.5.5, they perform exceptionally well in detecting small process shifts, making them especially suitable for automated precision machining. The MiDFUN SPC system already has built-in EWMA and CUSUM control chart modules, which directly correspond to the requirements of the new manual.
Acceptance Control Charts: according to ISO 3534-2 and manual §10.3.4, this chart type directly links process control to tolerance limits, and is suitable for processes with high process capability (Cpk > 1) where only ensuring that tolerances are not exceeded is required.
SPC Strategy for Short-Run Production
Citing manual §10.3.2.9, when the batch is insufficient to establish a normal distribution model, organizations should adopt an “alternative approach for stability assessment.” This typically involves monitoring the deviations of the same characteristic across different parts (same process) to achieve continuous process control. This scenario is precisely where the MiDFUN SPC Statistical Process Control system excels in low-volume, high-variety manufacturing environments—the system can perform cross-batch analysis on different parts of the same process, automatically aggregating historical data to determine stability.
Intelligent AISPC Implementation: Automatic Distribution Identification and On-Site Execution
The value of digital AISPC lies in eliminating human judgment errors and ensuring the compliance of calculation logic. The MiDFUN SPC Statistical Process Control system, combined with the MiDFUN AIQ Intelligent Quality system, can deliver the following intelligent functions required by the new manual.
AISPC Core Functions and Software Validation
Citing manual §11.2, all SPC analysis software must undergo Validation to ensure that its algorithms are consistent with the standard formulas.
Automatic distribution identification: the system should have the ability to automatically assess the data distribution (refer to manual §7.8.1). In addition to the normal distribution, it should be able to handle complex non-normal distributions (such as the Pearson distribution), which is crucial for the one-sided tolerances or asymmetric characteristics commonly found in the automotive industry.
Real-time feedback: automatically trigger the stability criteria described in §10.2.2, achieving second-level response for on-site decision-making.

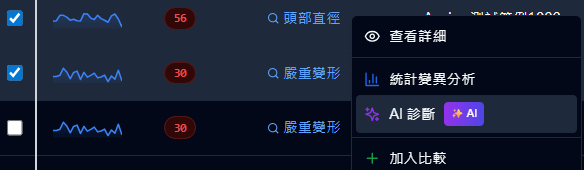
▲ MiDFUN AISPC system: AI diagnostic lab and real-time control chart monitoring interface
Execution and Recording of the Out-of-Control Action Plan (OCAP)
When an abnormal signal appears in SPC, an Out-of-Control Action Plan (OCAP) must be executed. According to manual §6.6, all actions taken and their results must be fully recorded. The MiDFUN SPC system, paired with the MiDFUN 8D Customer Complaint Management and Quality Improvement system, can automatically link abnormal signals with the corrective action process.
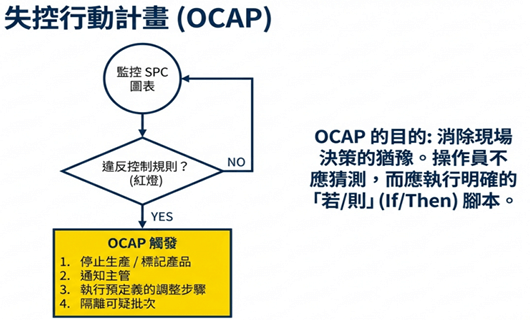
▲ Out-of-Control Action Plan (OCAP) flowchart: eliminating hesitation in on-site decision-making by executing a clear “if/then” script (Source: AIAG-VDA SPC Manual §6.6)
| OCAP Checklist Item | Required Guided Action | Reference Section |
|---|---|---|
| Signal Triggering | The system automatically alerts and locks the station. | 10.2.2 |
| Immediate Containment | Isolate all products produced since the last in-control point. | 6.6 |
| Cause Diagnosis | Distinguish between special causes (Systematic) and random causes (Random). | 5.3 |
| Closed-Loop Recording | Record all physical adjustments, repair actions, and verification results taken. | 6.6 |
| Process Restart | Perform additional sampling to verify that the process has returned to a stable state. | 2 |
Conclusion: Building a Continuous Improvement Quality Loop
The core value of the new AIAG-VDA SPC standard lies in establishing a “dynamic feedback system.” Statistical analysis itself is by no means the goal; its strategic significance lies in “deepening the understanding of the process and triggering meaningful action” (refer to manual §5.3). By regularly conducting process, product, and system audits (the six control loops), organizations can ensure the authenticity of data and maintain the vitality of the system, ultimately turning “prevention” into a core competitive advantage for the enterprise.
The MiDFUN SPC Statistical Process Control system is designed precisely on the philosophy above—from real-time data collection, automatic distribution identification, and intelligent criteria triggering to OCAP closed-loop management, it fully corresponds to the compliance requirements of the new AIAG-VDA SPC manual, helping automotive industry and manufacturing customers build a truly “prevention-oriented” quality management culture.
📚 Provenance and Standard Citation List
This implementation framework is strictly based on the following standards and guidelines:
▸ AIAG-VDA SPC Yellow Volume draft (Stakeholder Review)—Statistical Process Control reference manual
▸ IATF 16949—Automotive Quality Management System requirements
▸ ISO 9001 / ISO 11462—Quality Management System and SPC implementation guidelines
▸ ISO 22514—Statistical methods in process management (capability and performance)
▸ VDA 1, VDA 5, VDA 6—German automotive industry quality standards and measurement process validation
▸ AIAG CQI-28—Intelligent Quality Metrics guidelines
▸ ISO 3534 / ISO 7870—Statistical terminology, definitions, and control chart standards
📖 Glossary Quick Reference
SPC = Statistical Process Control, using data to monitor production stability | Cpk = process capability index (≥1.33 is acceptable; automotive special characteristics require ≥1.67) | Ppk = process performance index | FMEA = Failure Mode and Effects Analysis, a product “health check sheet” | OCAP = Out-of-Control Action Plan | EWMA = Exponentially Weighted Moving Average control chart | CUSUM = Cumulative Sum control chart | IATF 16949 = international quality management certification for the automotive industry | 5M1E = Man, Machine, Material, Method, Environment, Measurement
❓ Frequently Asked Questions (FAQ)
Q1: What is SPC statistical process control? What major changes does the new AIAG-VDA SPC Yellow Volume bring?
SPC (Statistical Process Control) is a quality management tool that uses statistical methods to monitor the stability of production processes in real time. Simply put, just like weighing yourself daily to track your health, SPC continuously tracks process data through control charts, intercepting anomalies before they occur. The most significant change in the new 2026 AIAG-VDA SPC manual (Yellow Volume) is that, for the first time, it harmonizes the statistical process control specifications of the two major systems—the U.S. AIAG and the German VDA—unifying the SPC implementation standards for the global automotive industry and strengthening the core philosophy of “prevention over detection.” The MiDFUN SPC Statistical Process Control system has already been aligned with the requirements of the new manual.
Q2: What impact does the new AIAG-VDA SPC manual have on IATF 16949-certified enterprises?
All automotive industry suppliers holding IATF 16949 certification need to pay attention to the changes brought by the new AIAG-VDA SPC manual. The new manual requires organizations to establish a risk-driven SPC implementation strategy (rather than applying SPC uniformly to all characteristics), strengthen the logical link between FMEA and the Control Plan, and clarify the roles and responsibilities across the six quality control loops. This means enterprises should review and update their existing SPC operating procedures before their next IATF 16949 audit.
Q3: How does the MiDFUN SPC system meet the new manual’s AISPC intelligent requirements?
The MiDFUN SPC Statistical Process Control system has many of the intelligent functions required by the new manual, including: automatic distribution identification (supporting normal and non-normal distributions such as the Pearson distribution), automatic triggering of real-time stability criteria, EWMA and CUSUM advanced control charts, Out-of-Control Action Plan (OCAP) closed-loop management, and systematic integration with FMEA and the Control Plan. All algorithms have undergone Validation, complying with the software compliance requirements of manual §11.2.
Q4: Can SPC also be implemented in low-volume, high-variety production environments?
Yes. The new AIAG-VDA SPC manual (§10.3.2.9) explicitly proposes an alternative SPC strategy for short-run production. By monitoring the deviations of different parts within the same process across batches, effective process control can be achieved even when the sample size is insufficient to establish a traditional normal distribution model. The MiDFUN SPC system provides a dedicated low-volume, high-variety analysis module for this scenario.
Q5: Besides SPC, what other quality management system products does MiDFUN offer?
MiDFUN has cultivated manufacturing quality management software for over 30 years, offering a complete quality management system product line, including: SPC Statistical Process Control, FMEA Failure Mode and Effects Analysis, SQM Supplier Quality Management, MSA Instrument Management and Calibration Analysis, APQP/PPAP Advanced Product Quality Planning, 8D Customer Complaint Management and Quality Improvement, TPM Total Productive Maintenance Management, AIQ Intelligent Quality system, and more—comprehensively covering the quality management needs of the automotive, electronics, semiconductor, and other industries.
Want to learn how to implement an intelligent quality management system that complies with the new AIAG-VDA SPC manual?
Since its founding in 1993, MiDFUN has cultivated manufacturing quality management software for over 30 years, serving industries including automotive components, automotive electronics, semiconductor, electronics manufacturing, and aerospace. From SPC Statistical Process Control to AIQ Intelligent Quality system, MiDFUN provides a complete quality digital transformation solution.
Copyright © 2026 MiDFUN Co., Ltd. Some rights reserved
Author: Pei-Chi Chiu. First published: 2026-02-05. Type: Quality Management Column
Original link: https://www.midfun.com.tw/qc/aiag-vda-spc-yellow-volume-analysis-2026/
This work is released under the Creative Commons Attribution-NonCommercial-NoDerivatives 4.0 International License (CC BY-NC-ND 4.0). You are welcome to share it freely, provided that you credit the original author, include the original link, do not use it commercially, and do not modify the content.
Suggested citation format: Chiu, P.-C. (2026). “AIAG-VDA SPC Yellow Volume Draft: Key Analysis and Application.” MiDFUN Quality Management Column.
For reprint permission and content inquiries: midfun@midfun.com.tw