


2026.07.09 | Pei-Chi Chiu
AIAG-VDA SPC Manual 2026: Key Changes to Pm/Pmk, Cp/Cpk, Reporting, and Software V&V
Conclusion first
Official 2026 edition AIAG & VDA SPC Manual moves SPC beyond a single statistical tool and establishes a common language for process management, capability studies, control charts, software validation, and report traceability. The manual is a non-mandatory consensus guideline. It generally becomes binding when a customer-specific requirement (CSR), contract, PPAP, or audit requirement cites it.
For the automotive supply chain, the new manual is about more than changed formulas. The practical questions are how to release equipment after a machine-performance study, how to name capability and performance indices, how to report non-normal data, how to verify and validate analysis software, and whether control charts, OCAP, and the Control Plan are connected on the shop floor.
This article explains the changes that quality, process, supplier-quality, and system-implementation teams should understand first, in language they can use for implementation discussions.
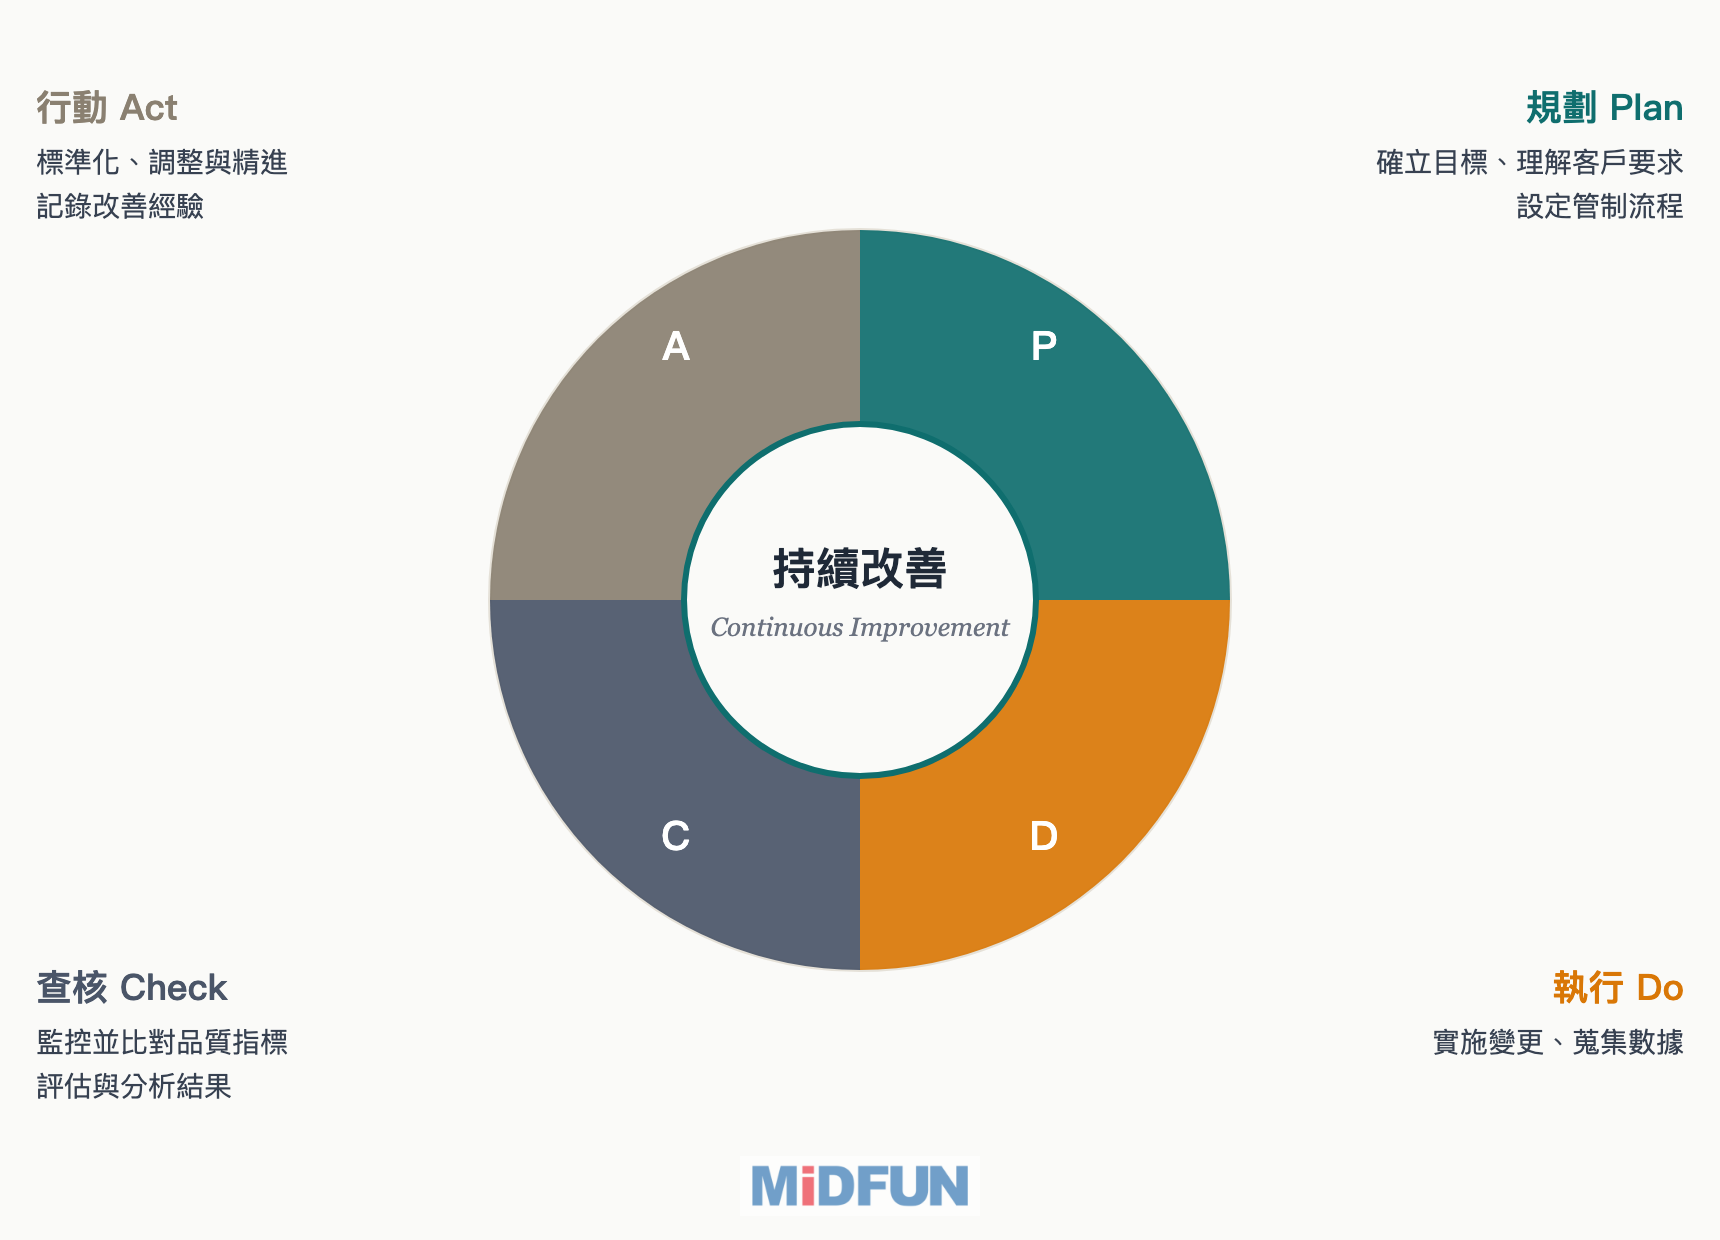
PDCA for SPC implementation
Plan
Define the study purpose, characteristic, data structure, and decision criteria.
Do
Collect time-ordered data under documented and representative conditions.
Check
Assess variation, statistical control, model fit, and uncertainty.
Act
Standardize effective action, monitor the process, and retain evidence.
Status
A non-mandatory consensus guideline that may be cited by a customer CSR or contract.
Core changes
Clearer treatment of capability/performance indices, time-dependent distributions, reporting, and software V&V.
Where to start
Inventory SOPs, report templates, SPC software parameters, and customer requirements first.
1. Not automatically mandatory, but now a common supply-chain language
AIAG and VDA jointly developed the manual to give the North American, European, and global automotive supply chains a more consistent basis for SPC terminology, report formats, and statistical methods. Companies should treat it neither as a new regulation nor merely as a textbook.
A practical first step is to use the manual as an internal gap-assessment baseline. Check whether current SOPs, training, capability-study reports, control-chart settings, software parameters, and customer CSRs align with its concepts. If a major customer or contract formally cites it, translate it into operating requirements.
2. Capability and performance indices: names reflect process status
The manual distinguishes machine performance, preliminary process performance, and production process capability more clearly. An index name is not just a symbol: it indicates whether the data support a stability claim and which release decision the study is intended to support.
| Study stage | Common indices | Key judgment |
|---|---|---|
| Machine performance study | Pm / Pmk | Used for equipment release. Consecutively produced samples generally assess machine-related variation while operator, material, method, and environmental conditions are held fixed or documented as far as possible. |
| Preliminary process performance | Pp / Ppk | Used when stability has not been fully demonstrated or the data are insufficient to claim capability. P denotes performance and must not be treated as equivalent to capability. |
| Production process capability | Cp / Cpk | C-type capability indices are appropriate only after the process has demonstrated statistical control. |
A Cpk/Ppk report therefore cannot be judged only by whether its value meets a target. Also check the collection period, sample size, stability assessment, control chart, and whether the index name matches those conditions.
Three distinct study stages
Machine performance
Evaluate equipment-related variation under defined short-run conditions.
Typical study: 50 consecutive parts · Pm / PmkPreliminary process performance
Evaluate early process output across representative operating conditions.
Performance evidence · Pp / PpkOngoing process capability
Use capability indices only after statistical control has been demonstrated.
Ongoing monitoring · Cp / Cpk when appropriate3. Machine performance studies: 50 samples are typical; compensate for smaller samples
The machine-performance section contains an easily missed point: a study normally uses 50 consecutively produced samples. When technical, cost, cycle-time, or sample-availability constraints make 50 impossible, a company cannot simply test fewer parts and retain the same threshold.
Practical note
A smaller sample increases uncertainty in the estimate. The manual compensates by adjusting the target value, so equipment-release records should state the sample size, conditions, method of customer agreement, and adjusted threshold.
Sampling across multiple production sources
Station A
Represent each machine, cavity, tool, or stream that can introduce distinct variation.
Station B
Keep time order, traceability, and actual production proportions visible.
Station C
Do not let a large pooled total hide an underrepresented source of risk.
4. Greater emphasis on non-normal distributions, time-dependent models, and reporting
The manual no longer forces every problem into a normal distribution. For geometric tolerances, wear trends, multimodal data, or non-stationary location changes, first understand how the process changes over time, then select a suitable distribution model, control chart, and sampling strategy.
This also changes reporting. The examples emphasize making the source, sample information, distribution model, stability assessment, index calculation, and—when needed—confidence intervals understandable. A single Cpk value cannot communicate sampling uncertainty or process conditions.
Capability paths for non-normal data
General geometric method
Estimate relevant distribution quantiles and compare their distance to specification limits.
Report the fitted distribution and assumptions.z-score method
Convert tail probabilities to equivalent standard-normal z scores for capability interpretation.
Report the transformation and tail model.Traceable handling of suspected outliers
Flag
Preserve the original observation.
Document
Record time, lot, source, and context.
Investigate
Seek an assignable cause and supporting evidence.
Decide
Retain or exclude only with traceable justification.
Verify
Confirm the action and monitor recurrence.
What a defensible capability report shows
Time order & control chart
Show signals, limits, subgrouping, and the period studied.
Distribution & model
Model fitProbability plotTail behavior
State assumptions and data treatment.Indices & uncertainty
Cp / CpkPp / PpkConfidence interval
Interpret values in the study context.5. Analysis-software V&V: buying software is not the finish line
The manual distinguishes verification from validation for analysis software. Verification confirms that specified requirements and expected results are implemented correctly; validation confirms fitness for intended use under defined operating conditions.
In other words, do not ask only whether the SPC software can calculate Cpk. Also ask:
- Can it retain customer-specific parameter settings and versions?
- Can it identify different calculation methods such as .G and .Z?
- Can it retain sample size, distribution model, outlier treatment, and confidence-interval settings?
- Can it reproduce the statistical conditions used for a historical report?
With manual spreadsheets, the main risk is not whether they can produce a number, but whether parameter transparency, version control, access, traceability, and customer-specific settings can withstand an audit.
Software validation and verification
Validation
Does objective evidence show that the software is fit for its intended use in the defined operating context?
Focus: intended use and real workflowVerification
Does objective evidence show that specified requirements and expected outputs have been implemented correctly?
Focus: requirements and correct results6. Six checks before implementation
- Review customer CSRs:Confirm whether major automotive customers cite the AIAG-VDA SPC Manual 2026.
- Review capability reports:Check whether Cpk/Ppk/Cw/Cwk and Pm/Pmk names align with the stability prerequisites.
- Review sample-size rules:Confirm sample sizes, sampling frequency, and compensation for insufficient samples in machine-performance and process-capability studies.
- Review distribution models:Check whether non-normal, time-dependent, multimodal, or geometric-tolerance data are still being forced into a normal model.
- Review software V&V:Confirm that SPC analysis software is verifiable, configurable, and traceable.
- Review OCAP:Write control-chart signals, cause investigation, disposition, and escalation paths into shop-floor workflows.
July 30 Online Seminar: AIAG-VDA SPC 2026 Explained
MiDFUN will host an online seminar on July 30, 2026, covering index logic, sample-size adjustments, report formats, software V&V, and system implementation. Refer to the latest MiDFUN website announcement for registration and the meeting link.
Frequently asked questions
Is the AIAG-VDA SPC Manual 2026 mandatory?
The manual itself is a non-mandatory consensus guideline. It creates specific execution requirements for a supplier when cited by a customer CSR, contract, PPAP, or audit requirement.
Does the new manual mean Cpk can no longer be used?
No. Cpk remains applicable when process stability has been demonstrated. If stability has not been investigated or does not hold, describe performance with Pp/Ppk. Use Cw/Cwk as a diagnostic tool when within-group variation must be analyzed.
Must every SPC report include a 95% confidence interval?
The examples emphasize confidence intervals, but customer and supplier should agree on the actual report format and content. In practice, capability/performance indices, estimated nonconformance rates, and small-sample cases should include a confidence interval or uncertainty statement.
What should a company do first?
Perform a gap assessment covering customer requirements, report templates, sample-size rules, control-chart selection, software V&V, traceability, and OCAP. Waiting for a formal customer demand usually leaves the organization reacting under pressure.
Source note: This article presents MiDFUN’s study of AIAG & VDA Statistical Process Control (SPC) Manual, 1st Edition 2026. This is MiDFUN’s study summary and implementation perspective, not an official AIAG/VDA publication. Always follow the official English manual, customer CSRs, and the applicable contract.
Related reading:MiDFUN SPC System; SPC Software Selection and Comparison; Complete Guide to SPC Control Charts