
Since SPC was born, nearly a century has passed (1931-2023), and production patterns have already shifted from the mass production of the past to low-volume, high-variety and even custom production. Over the past 30 years, SPC has likewise adapted to the change in production methods, and statistical methods and the associated control charts have kept evolving. Let me now introduce the latest control charts in use, and along the way talk about which practical applications exist under modern automation. If anyone is interested in learning more, you are welcome to join our seminars or raise relevant questions with MiDFUN, so that together we can raise Taiwan’s competitiveness!
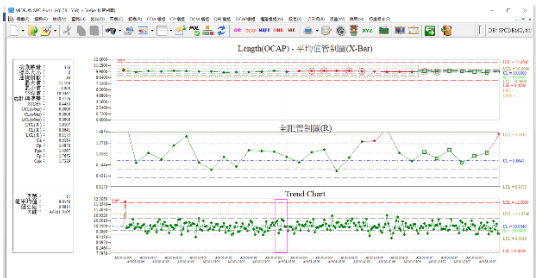
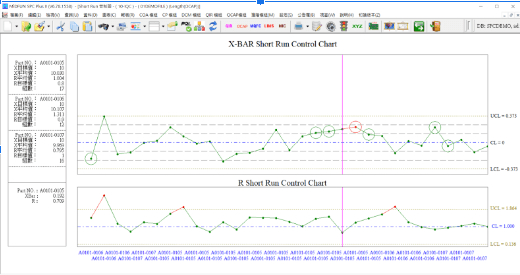
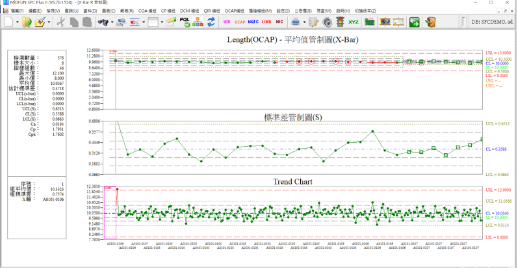
1. Low-volume, high-variety control charts ___ SHORT RUN control charts, XBAR-R Trend, XBAR-S Trend Chart
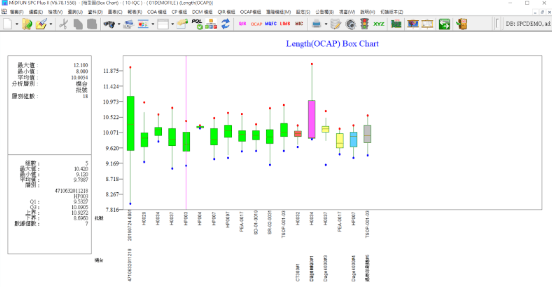
2. Box Chart
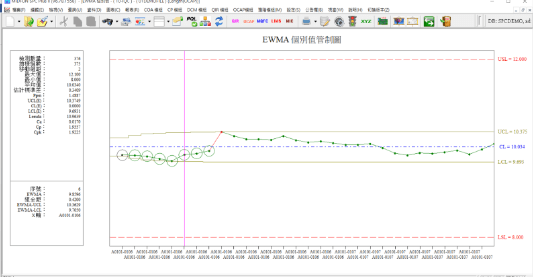
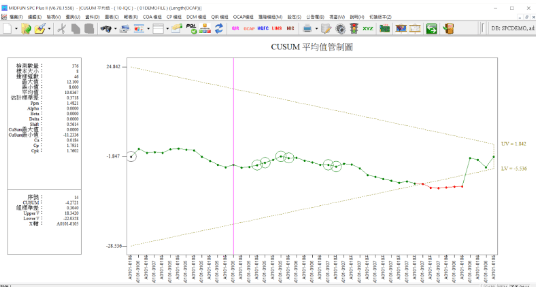
3. Small-shift control charts __ EWMA exponentially weighted moving average control chart, CUSUM cumulative sum control chart
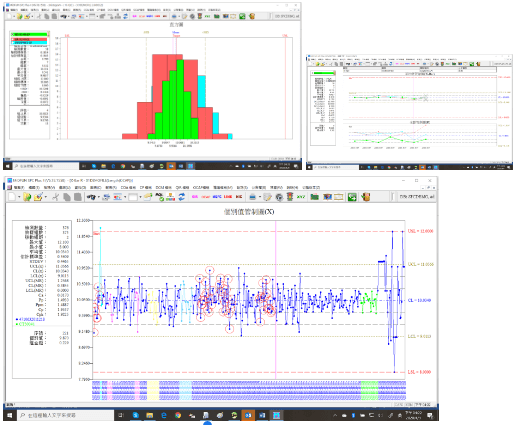
4. Multi-angle comprehensive analysis charts __ same product across multiple machines, multiple shifts, multiple lines ___ overlaid control charts, overlaid histograms, stratified annotated analysis charts
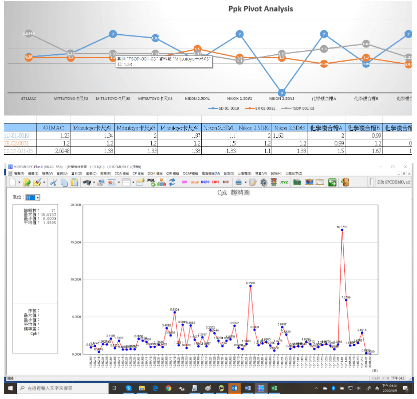
5. Trend + multi-angle __ pivot analysis charts, Cpk trend charts…
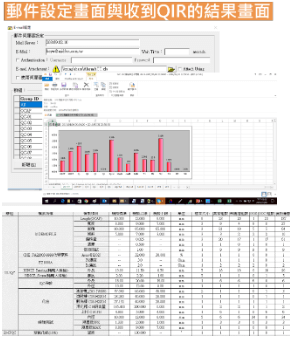
6. Management-perspective analysis ___ QIR automated reports, usually using anomaly handling tracking tables, statistical data listings, control upper/lower limit listings, OOS/OOC Rate tables, and the like, to let managers understand which items are the most urgent improvement priorities for the factory
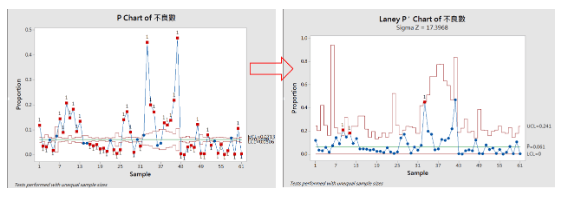
7. Attribute Laney’P chart _ For modern attribute inspection with a small number of anomalies, using the traditional P chart easily causes misjudgments; switching to the Laney’P chart can reduce the chance of misjudgment through Sigma Z and effectively control quality
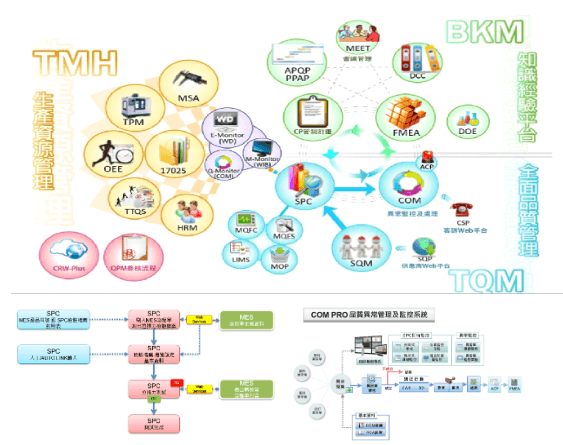
8. Integration __ ERP/MES integration, CP-SPC integration, SPC-8D integration, and so on; see the example below
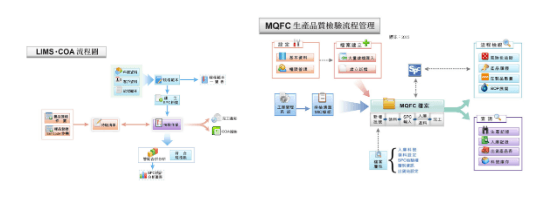
9. Other items __ OCAP, quality traceability MQFC, laboratory quality LIMS
10. Automation __ fully automated inspection instrument connectivity, semi-automated instrument connectivity, manual machine connectivity such as 2.5D, lights-out factory and robot connectivity….
(with various video file links)
Copyright © 2023 MiDFUN Co., Ltd. Some rights reserved
Author: Pei-Chi Chiu. First published: 2023-02-14. Type: Quality Management Column
This work is released under the Creative Commons Attribution-NonCommercial-NoDerivatives 4.0 International License (CC BY-NC-ND 4.0). You are welcome to share it freely, provided that you attribute the original author, include the original link, make no commercial use, and do not modify the content.
Suggested citation format: Chiu, Pei-Chi (2023). “SPC Modern Quality Automated Control Charts and Analysis.” MiDFUN Quality Management Column.
Reprint authorization and content inquiries: midfun@midfun.com.tw