Pei-Chi Chiu | February 5, 2026
SPC Statistical Process Control
Pre-Control Chart
AI Quality Management
High-Mix Low-Volume
About This Article
Written by Pei-Chi Chiu, Senior Consultant at MiDFUN, this article explores quality management strategies for high-mix low-volume (HMLV) production environments. It proposes a strategy built on the pre-control chart (rainbow chart) and paired with a “dual-track parallel” AI adoption approach—combining the MiDFUN SPC Statistical Process Control System with AI analytics to deliver a robust and deployable smart quality management solution for manufacturers.
The Quality Dilemma of the High-Mix Low-Volume Era—and a New Solution
In my career of more than three decades in manufacturing, two words have been the cornerstones of survival: “Precision” and “Reproducibility” (that is, process stability). Yet in today’s era, where “High-Mix Low-Volume (HMLV)” has become mainstream, these two principles are facing unprecedented challenges. Statistical Process Control (SPC), traditionally relied upon to maintain process stability, often struggles to establish control limits with “reproducibility” when confronted with the reality of frequent changeovers and minimal output per batch—simply because there is not enough data. This directly threatens the most core principle of “precision,” reducing the reliability of quality monitoring and driving up production risk.
Faced with this dilemma, many companies have turned to artificial intelligence (AI), hoping it will be a cure-all for their problems—only to encounter repeated setbacks during actual implementation. This article aims to share a pragmatic solution grounded in industry practice. Rather than blindly chasing new technology, it advocates returning to the essence of manufacturing, fusing battle-tested traditional statistical tools with advanced AI analytics to provide a robust and deployable strategy for the quality control challenges of high-mix low-volume production.
The Pre-Control Chart (Rainbow Chart): A Solid Foundation for High-Mix Low-Volume Quality Management
In a production environment characterized by high mix, low volume, and fragmented data, rather than forcing the application of complex statistical models designed for big data, it is better to return to a management tool that is more intuitive and closer to the needs of shop-floor operators. The Pre-Control Chart—also known as the “Rainbow Chart” because of its distinctly color-coded zones—is exactly such an underrated yet extremely practical tool. It shifts the focus of quality management from the statistical analysis performed by quality engineers to the real-time prevention carried out by production-line operators.
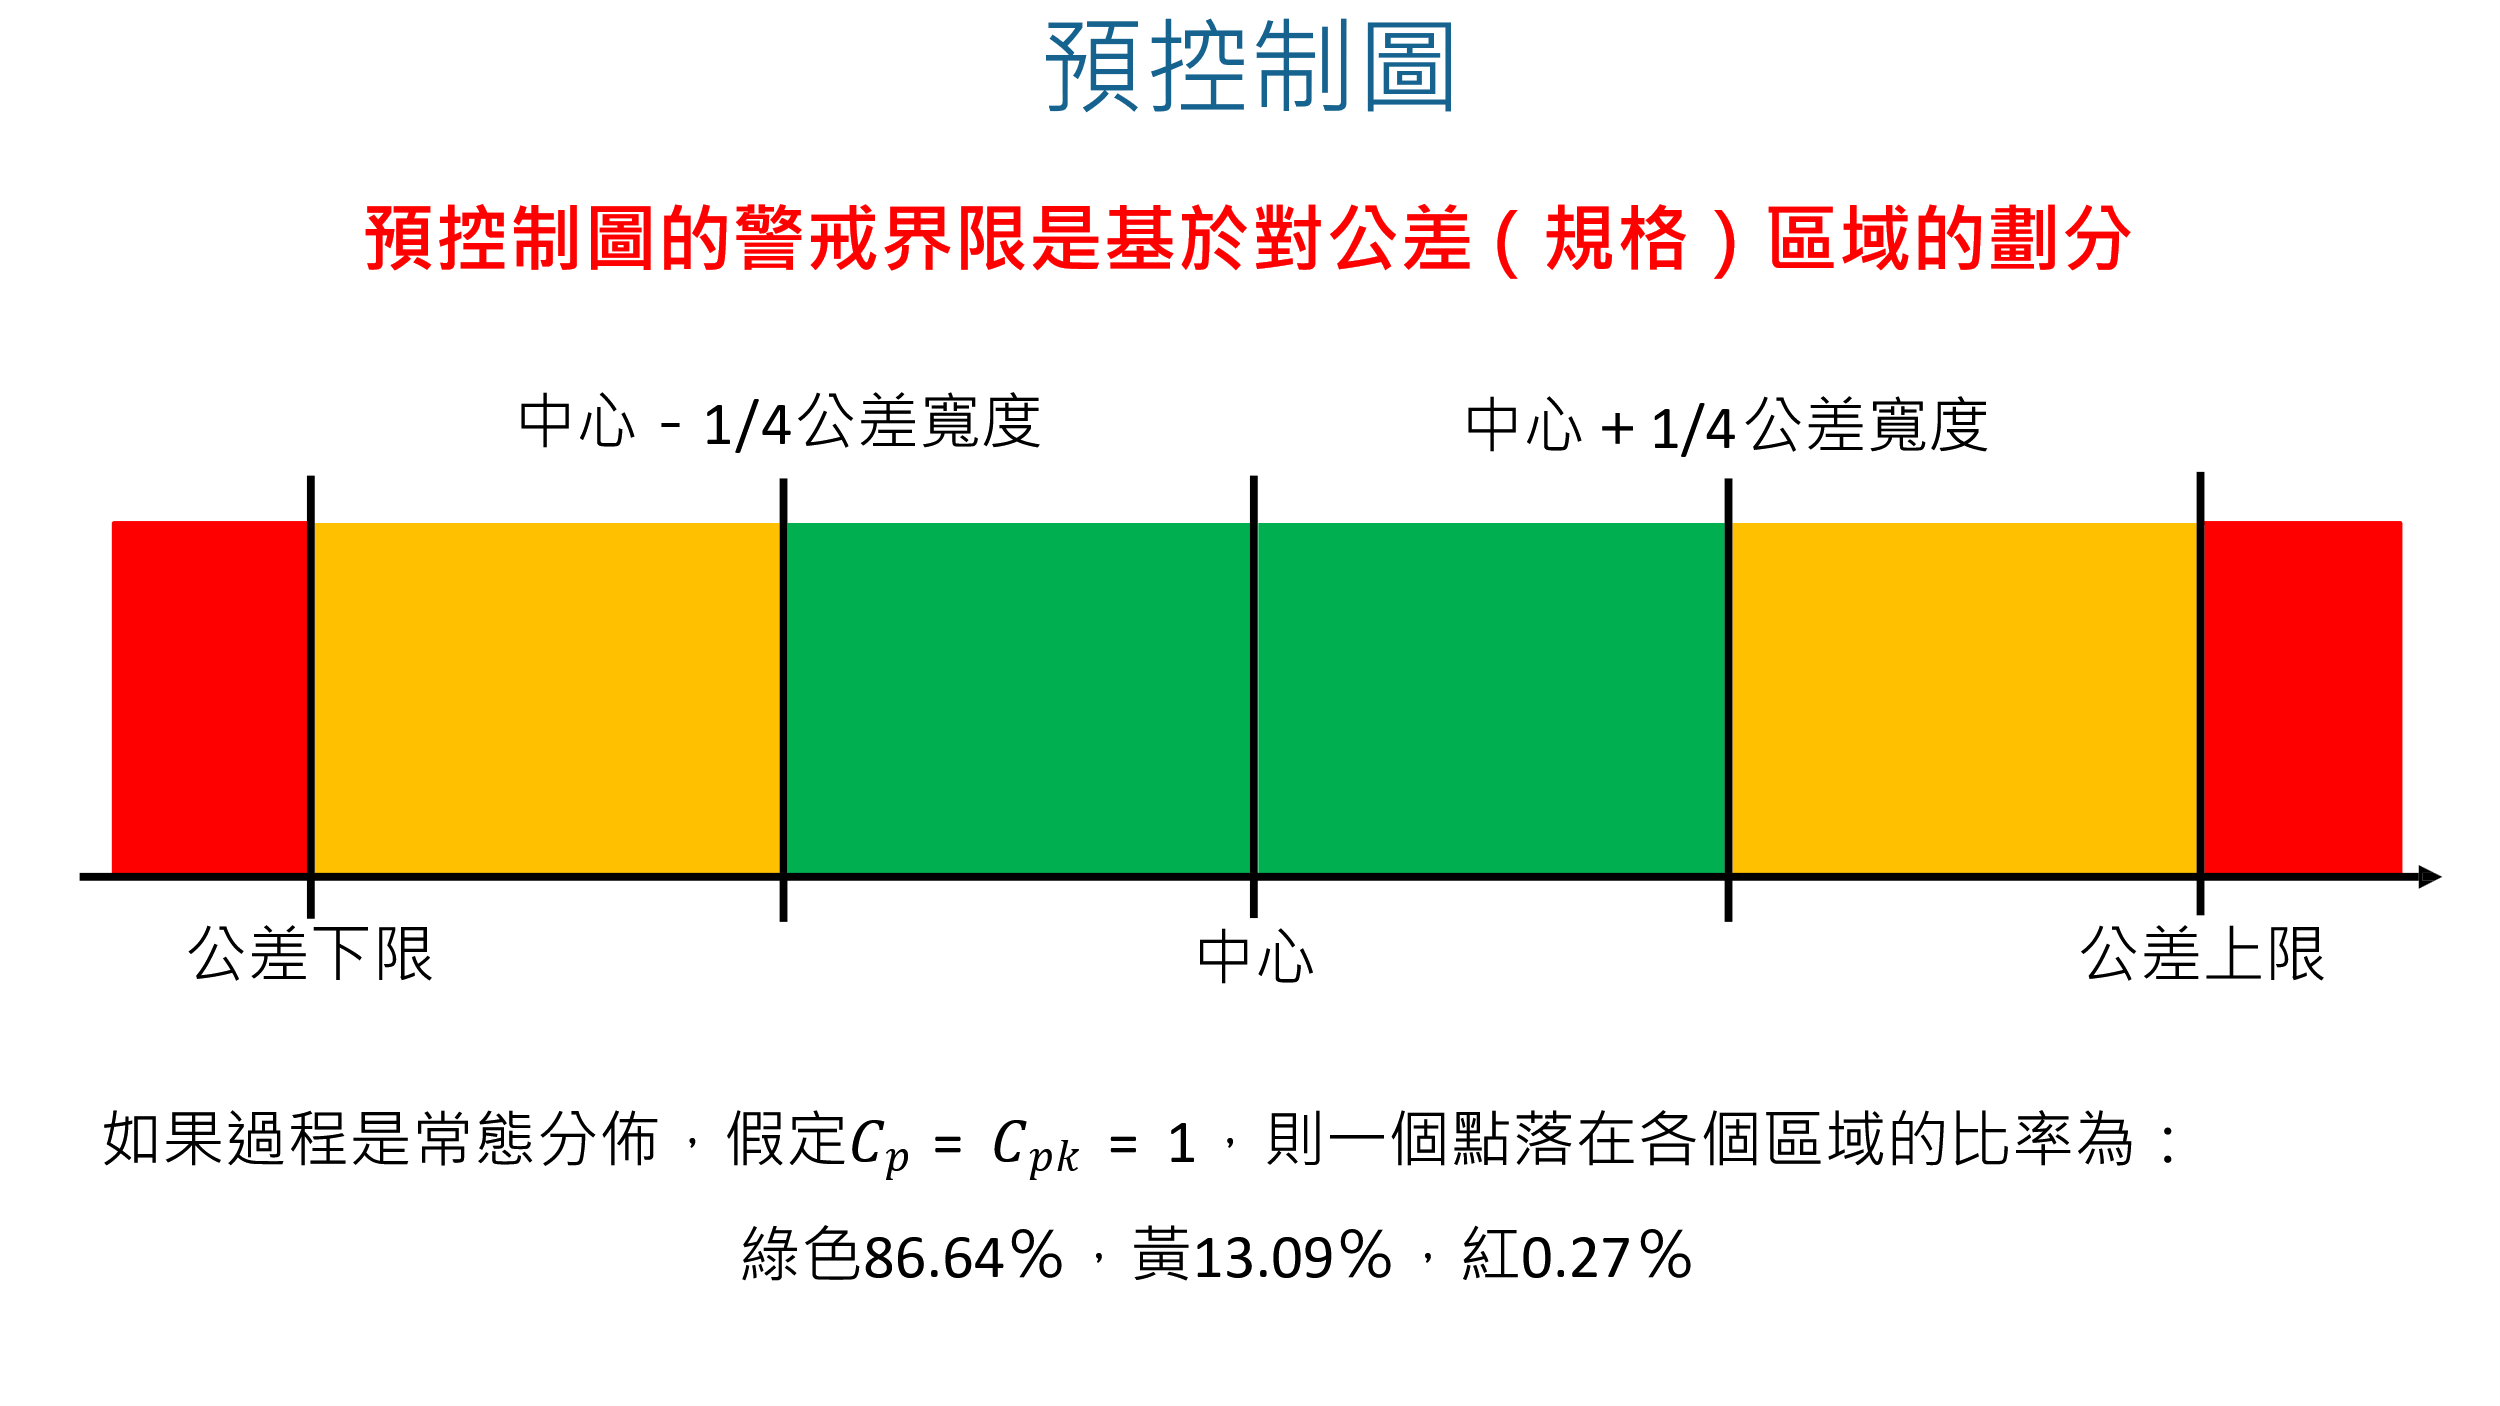
The warning-limit division of the pre-control chart: the green zone (target zone) occupies the middle 50% of the tolerance, the yellow zones (caution zones) occupy 25% each, and the red zone (reject zone) lies beyond the specification limits.
To more clearly understand its tactical value, the pre-control chart can be compared with the traditional control chart:
| Characteristic | Traditional Control Chart | Pre-Control Chart (Rainbow Chart) |
|---|---|---|
| Decision basis | Based on statistical control limits (3σ principle) | Based on specification tolerance limits (USL/LSL) |
| Data requirement | Requires a large, stable dataset to compute the limits | Suitable for small-batch production; low data requirement |
| Operational complexity | Requires calculation, plotting, and trend interpretation | Intuitive judgment from green, yellow, and red zones—no calculation needed |
| Primary user | Quality engineer | Shop-floor operator |
The reason the pre-control chart works so effectively in high-mix low-volume scenarios lies in its three core advantages and a clear set of practical guidelines:
Visual Management That Lowers the Skill Barrier
The pre-control chart translates complex statistical risk into “traffic-light” rules that shop-floor personnel understand at a glance: the green “target zone” means it is safe to proceed, the yellow “caution zone” prompts observation, and the red “reject zone” means stop immediately. Operators need no deep statistical background—they can judge the health of the process by color alone.
Prevention Before the Fact, Not Remediation After
This is where the pre-control chart is most valuable. A traditional control chart often raises an alarm only after the process has already shifted, whereas the pre-control chart’s “yellow zone” plays a crucial early-warning role. When a measured value falls into the yellow zone, the product itself is still conforming, but the system has already warned in advance that the process may have experienced a center shift or an increase in variation. This allows operators to intervene and adjust before nonconforming products (the red zone) are actually produced, truly realizing the mindset shift from “remediation after the fact” to “prevention before the fact.”
Empowering the Production Line with Self-Management
Because the pre-control chart is simple to use and its decision rules are clear, it returns the first line of defense in quality management to the production-line operators. To unleash the full power of this tool, the shop floor must follow a clear set of practical guidelines:
⚠️ Prerequisite for use: The pre-control chart is best suited to scenarios where the equipment’s processing capability already meets the tolerance requirements (Cpk ≥ 1.0 is recommended, with ≥ 1.33 being ideal). If the equipment itself has excessive variation, the pre-control chart will frequently trigger stoppage alarms; in that case, equipment capability should be improved first rather than forcing the chart into use.
Setup Qualification: When processing of an operation begins, 5 consecutive parts must be sampled; only if all measured values fall into the green zone does it indicate that the process state is stable and that production can formally begin.
Monitoring Rules: During production, 2 consecutive parts are sampled each time—2 green means the process is normal; 1 green and 1 yellow means it is normal but heightened vigilance is required; 2 yellow on the same side means a center shift requiring adjustment as appropriate; 2 yellow on opposite sides means variation has increased and the line must be stopped for investigation; 1 red means stopping immediately for quality analysis and corrective action.
Acceptance Chart vs. Pre-Control Chart: Differences in Principle and Application Strategy
The essence of SPC is that it shifts the focus of quality management from traditional “passive detection” relying on finished-product inspection to “proactive prevention” that intervenes before problems occur. Within this framework, the Acceptance Chart and the Pre-Control Chart each play different strategic roles.
The Strategic Advantages SPC Brings
By effectively managing variation, companies can gain strategic advantages that go beyond mere quality improvement: reducing waste (detecting process problems early and preventing the production of defective products), improving efficiency (automated data collection and real-time monitoring make process adjustments faster), controlling costs (identifying and resolving problems at an early stage), enhancing customer satisfaction (stable, high-quality products significantly reduce customer complaints), and improving analytical capability (detailed data reports enable manufacturers to track performance over the long term).
The Underlying Principle and Application of the Acceptance Chart
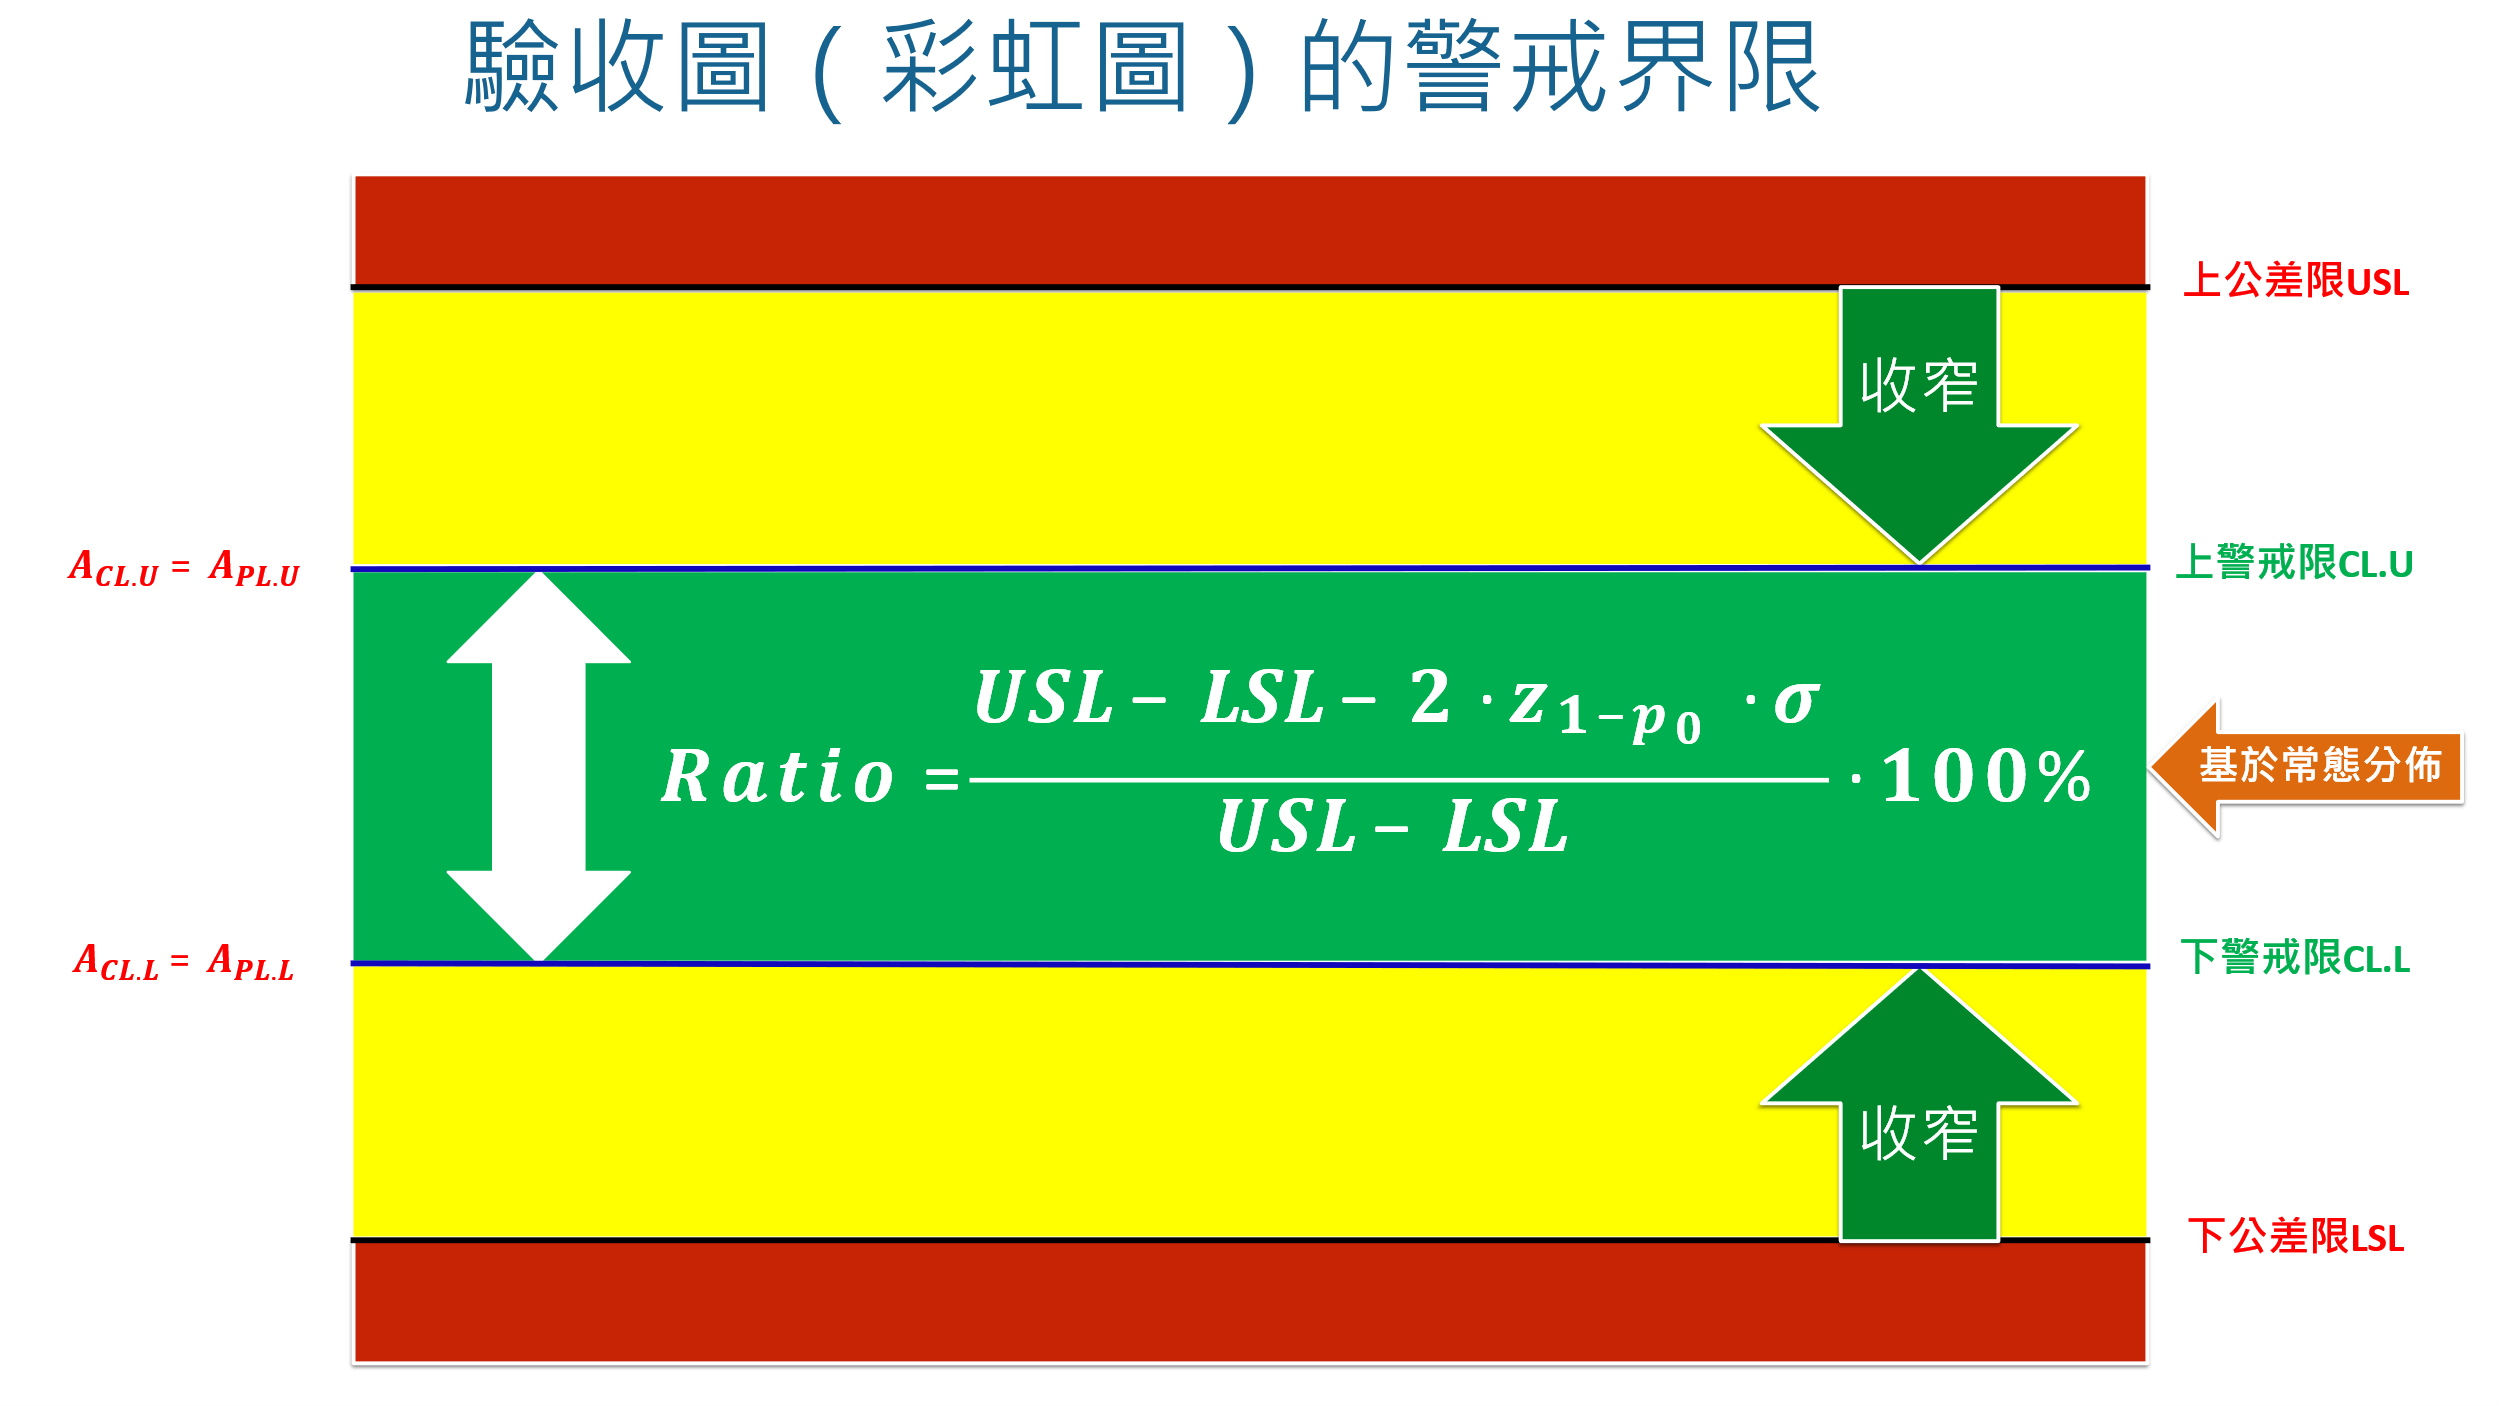
In the strategic layout of quality control, the “acceptance” standard plays the role of a goalkeeper. The Acceptance Chart may appear to be based on “detection,” but its strategic purpose within a modern quality framework is in fact to verify the effectiveness of upstream preventive measures. It provides a critical data feedback loop used to confirm whether front-end process control has successfully kept variation within an acceptable range. The acceptance chart is not only the last line of defense against the escape of nonconforming products, but also the touchstone for evaluating whether the entire prevention system is robust.
The three most common application scenarios for the acceptance chart in manufacturing processes are: final product inspection (ensuring finished goods fully meet all compliance requirements and customer specifications), supplier incoming quality verification (verifying quality before raw materials or components enter the production line), and critical process gate release (using a data-driven approach to decide, within a multi-step production process, whether a batch can proceed to the next stage).
Core Comparison of the Acceptance Chart and the Pre-Control Chart
| Characteristic | Acceptance Chart | Pre-Control Chart |
|---|---|---|
| Primary objective | Ensure the product meets the final specification | Prevent abnormalities from occurring in the process |
| Monitoring focus | Output result | Process stability |
| Quality strategy | Inspection-based quality assurance | Prevention-based quality control |
| Reaction timing | After the production batch is completed | Real-time or near real-time |
In summary, the acceptance chart can be seen as the “goalkeeper” of quality standards, ensuring that final output meets requirements, while the pre-control chart serves as the “early-warning system” of process health, sounding the alarm while a problem is still in its infancy. The core trade-off between the two is this: the acceptance chart ensures final compliance, whereas the pre-control chart is dedicated to maintaining continuous process health.
To truly realize the potential of SPC, one must leverage automated, real-time data collection and analysis tools such as the MiDFUN SPC Statistical Process Control System. Solutions of this kind can automate the tedious data-processing workflow and provide real-time insight, transforming quality management from passive response to proactive guidance.
The Dual-Track Parallel Strategy: Fusing “Statistics First, AI as Support” for Precise Control and Knowledge Transfer
Amid the wave of AI adoption, manufacturers must keep a clear head. The goal is not the flashiest technology, but a pragmatic solution that guarantees “precision” and “reproducibility.” To that end, this article proposes a “dual-track parallel” adoption strategy that strictly separates process control—which directly affects the product and is critical to “precision and reproducibility” (Track One)—from knowledge management, which has a higher tolerance for error and emphasizes assistive efficiency (Track Two). This allows companies to enjoy the convenience AI brings while effectively avoiding the potential risk its uncertainty poses to the core stability of the production line.
Track One: Process Optimization Centered on “Precision” (Statistics First, AI as Support)
When the goal is process control that directly affects product yield and specifications, the strategy must be “statistics first, AI as support.” The cornerstone of success on this track is high-quality, trustworthy structured data. Here, AI plays the role of reinforcement and assistance, not a replacement for the statistical methods proven over decades. Through this fusion, smarter “AISPC” applications can be built:
Handling high-dimensional and nonlinear data: The number of parameters that must be monitored and regulated in a production process can reach into the hundreds or even thousands. AI algorithms (such as XGBoost, CNN, and LSTM) can effectively handle this kind of complex data that traditional SPC struggles to address, detecting signs of process abnormality earlier while reducing the false-alarm rate.
Solving the data-scarcity problem: Transfer Learning techniques directly address the thorniest “cold start” problem in high-mix low-volume production. By “transferring” the knowledge of a model trained on a similar process and then fine-tuning it with a small amount of new product data, even an output of only a few dozen units can be brought into effective quality monitoring from the very first product.
Realizing Virtual Metrology: For certain key quality indicators that are costly or time-consuming to inspect, an AI model can predict them based on real-time process parameters collected on the fly, greatly shortening the response time of quality feedback and effectively reducing measurement costs.
Track Two: Decision Support Centered on “Knowledge Management” (LLM + RAG AI Assistant)
On a high-mix low-volume shop floor, even an experienced veteran master cannot remember the process characteristics and troubleshooting methods of every product, leaving much valuable tacit knowledge difficult to pass on. By combining a Large Language Model (LLM) with Retrieval-Augmented Generation (RAG) to integrate unstructured data within the factory—such as SOPs, equipment repair manuals, and historical abnormality-handling records—a genuinely useful “AI assistant” can be built.
Its application value includes: shop-floor personnel can quickly query the changeover steps or parameter settings of a specific product in natural language, replacing the need to flip through thick paper documents; when equipment malfunctions, the AI assistant can provide possible root-cause analysis and preliminary troubleshooting suggestions based on historical experience data, shortening downtime; and the AI assistant acts like a tireless mentor, answering new employees’ questions at any time, accelerating their learning curve and effectively achieving the scaled transfer of knowledge. MiDFUN’s BKM Enterprise Knowledge & Experience Management System and AIQ Intelligent Quality System are designed precisely for this purpose.
Conclusion: Return to Essentials and Build a Robust Future for Smart Quality Management
As manufacturers embrace AI, they should constantly return to the two business essentials of “precision” and “reproducibility,” and avoid the blind herd mentality of adopting AI for AI’s sake.
More than three decades of industry experience have repeatedly proven that a successful smart transformation is never an overnight technological revolution, but a steady, solidly grounded strategic evolution. The key to success lies in this: first stabilize the foundation of quality management with pragmatic, intuitive tools such as the pre-control chart, empowering the production line with the ability to manage itself; then, through the prudent “dual-track parallel” strategy, apply AI technology precisely to the areas where it can create the most value—namely, reinforcing precise process control and accelerating the transfer of valuable knowledge. The essence of this strategy is that the pre-control chart not only stabilizes the process, but also cultivates quality awareness among personnel, laying the indispensable organizational and data foundation for subsequent data-driven (AISPC) and knowledge-assisted (AI assistant) capabilities.
Looking ahead, a truly resilient and efficient new era of smart manufacturing will be built on the perfect combination of deep human industry wisdom, the rigorous logic of traditional statistics, and the powerful assistive capabilities of AI.
Key Terms
| SPC | Statistical Process Control—using data to monitor production stability, like weighing yourself every day to track your health. |
| Pre-Control Chart | Pre-Control Chart, also known as the Rainbow Chart—a quality management tool that intuitively judges process state using green, yellow, and red zones. |
| HMLV | High-Mix Low-Volume—a production mode with many product types but a small quantity of each. |
| RAG | Retrieval-Augmented Generation—a technique that lets AI consult relevant materials before answering, improving the accuracy of its responses. |
| Transfer Learning | Transfer Learning—rapidly applying the quality-judgment experience learned on product A to a similar product B. |
Source: AIAG SPC Reference Manual; MiDFUN
Frequently Asked Questions
Q: What is a pre-control chart (rainbow chart), and how does it differ from an ordinary SPC control chart?
A: A pre-control chart is a quality tool that judges process state using green, yellow, and red zones; it is also called the rainbow chart. Its biggest difference from a traditional SPC control chart is that it does not require a large amount of data to compute control limits—instead, it divides the zones directly based on the product’s specification tolerance, making it especially suitable for high-mix low-volume (HMLV) production environments. Shop-floor operators need no statistical background; they can decide whether to stop and adjust simply by looking at the color.
Q: In a high-mix low-volume production environment, how should an SPC system be implemented to be effective?
A: A “dual-track parallel” strategy is recommended. Track One uses the MiDFUN SPC system paired with AI support (AISPC), employing techniques such as transfer learning to solve the data-shortage problem so that a new product can be monitored from the very first piece. Track Two uses LLM + RAG technology to build an AI assistant that helps shop-floor personnel quickly look up SOPs and troubleshooting methods. Stabilize the foundation with the pre-control chart first, then gradually introduce advanced AI capabilities.
Q: Can AI directly replace traditional SPC statistical methods?
A: Not advisable. AI should “support” rather than “replace” traditional statistical methods. In the domain of process control that directly affects product yield, statistical methods have been validated over decades and are the cornerstone of ensuring precision and reproducibility. AI’s strengths lie in handling high-dimensional data, solving the cold-start problem of data scarcity, and realizing virtual metrology—all of which reinforce statistical methods rather than replace them.
Q: What can MiDFUN’s SPC system do when combined with AI?
A: The MiDFUN SPC Statistical Process Control System supports automated data collection and real-time monitoring. Combined with AI technology, it can realize AISPC applications, including using algorithms such as XGBoost and CNN to handle complex multi-parameter process data, using transfer learning so that high-mix low-volume products can also rapidly establish monitoring models, and using virtual metrology to predict key quality indicators—greatly reducing measurement cost and time. MiDFUN also offers the AIQ Intelligent Quality System and the BKM Enterprise Knowledge & Experience Management System, supporting a complete transformation toward smart quality management.
Q: Besides SPC, what other quality management systems does MiDFUN offer?
A: Founded in 1993, MiDFUN has cultivated manufacturing quality management software for over 30 years and offers a complete set of quality management solutions, including SQM Supplier Quality Management, SPC Statistical Process Control, FMEA Failure Mode and Effects Analysis, MSA Gauge Management and Calibration Analysis, APQP/PPAP Advanced Product Quality Planning, 8D Customer-Complaint Management and Quality Improvement, TPM Total Productive Maintenance Management, QPM Quality Process Electronic Approval, BKM Enterprise Knowledge & Experience Management, and the AIQ Intelligent Quality System—serving industries spanning electronics manufacturing, automotive components, semiconductors, automotive electronics, and aerospace.
About MiDFUN
MiDFUN was founded in 1993 and has cultivated Taiwan’s manufacturing quality management software field for over 30 years, providing the electronics manufacturing, automotive components, semiconductor, automotive electronics, and aerospace industries with
SPC Statistical Process Control,
AIQ Intelligent Quality System,
BKM Enterprise Knowledge & Experience Management, and other system solutions, helping companies achieve the digital transformation of quality management.
Contact Us
Copyright © 2026 MiDFUN Co., Ltd. Some rights reserved
Author: Pei-Chi Chiu. First published: 2026-02-06. Type: Quality Management Column
Original link: https://www.midfun.com.tw/qc/hmlv-precontrol-ai-spc-quality-strategy/
This work is released under the Creative Commons Attribution-NonCommercial-NoDerivatives 4.0 International License (CC BY-NC-ND 4.0). You are welcome to share it freely, provided that you credit the original author, include the original link, do not use it commercially, and do not modify the content.
Suggested citation format: Chiu, P.-C. (2026). “Mastering the High-Mix Low-Volume Challenge: A New Quality Management Strategy Fusing Pre-Control Charts with AI.” MiDFUN Quality Management Column.
For reprint permission and content inquiries: midfun@midfun.com.tw