1. From Q to P: Easy to Know, Hard to Do
Globalization has waned under the impact of low-volume, high-variety production and regional protectionism. Quality requirements, on the other hand, have grown ever more important amid supply-chain disruptions, while the influence of ISO and IATF keeps rising, demanding unified international standards that sustain high-quality products at reasonable prices. As a result, quality precision has leapt into the mainstream over the past two years, a phenomenon that brings both joy and worry.
The joy is that only by implementing SPC-Q and truly adjusting the process parameters (Process Parameter, abbreviated P) properly so that they are well controlled can the old saying “quality is manufactured in” finally have a chance to come true, and only then does the “McDonaldized quality control” ideal of shipping without outgoing inspection become genuinely attainable.
The worry is that, however beautiful the realm of P&Q may be, the road there is fraught with obstacles. One obstacle is that, compared with the specifications of product quality (Product Quality, abbreviated Q), the specifications of process parameters (Process Parameter, abbreviated P) carry a “lost in the clouds” quality. For their own benefit, customers will always define the product specifications (Q) crystal clear; but what about the process-parameter specifications (P)? Take semiconductor wafer packaging as an example: who defines the specification of the wire bonder? And within what range should the process parameters be set to be appropriate? In the past, when people ran into this kind of question, they mostly turned to the equipment supplier or the material supplier for guidance. But does a specification obtained in this player-as-referee manner have any meaning? Consider it from the supplier’s standpoint: to protect its own interests, what kind of specification would it provide? If the specification it provides is looser, would that not load itself with heavier liability? Once this stance is understood, it is not hard to see why the process-parameter specifications (P) that suppliers so enthusiastically provide mostly tend to be strict and impractical. This is also why many factories, even when their actual process parameters have clearly exceeded the specification, will still continue mass production by referring to “past experience” — a contradictory phenomenon.
Another difficulty with process-parameter specifications (P) is that the link between them and product-quality specifications (Q) is often unclear. In other words, cases where P is normal but Q is defective are frequently heard of, and cases where P is abnormal but Q is fine are even more common. If this contradiction in the cause (P) and effect (Q) relationship is not clarified, how can anyone be encouraged to press bravely forward?
2. When Action Fails, Return to the Starting Point
Although P&Q is well intentioned, since a string of difficulties lies in the way and it cannot be achieved in a single stride, rather than rushing blindly ahead, it is better to return to the starting point and reconsider the relationship between Q and P from the beginning — which may instead reveal a way through where the path once seemed blocked.
What is the purpose of P&Q? Is it not the hope that process control (P), controlled in advance, can make after-the-fact product quality (Q) fall within the expected range? If P is the method and Q is the goal, then driving SPC quality should still start from Q — that is the right path.
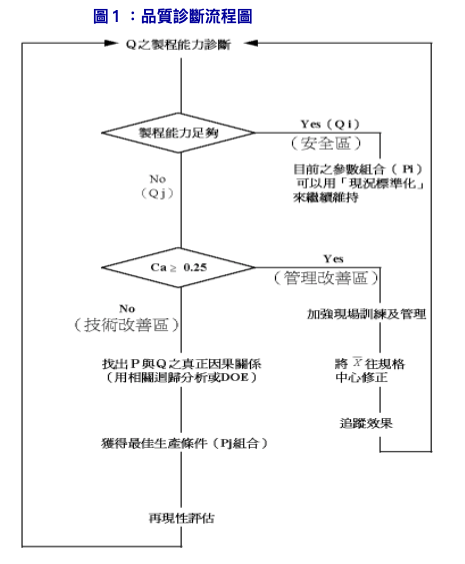
What is meant by starting from Q is that one must first perform a complete diagnosis of Q, looking at the existing quality characteristics to see, in terms of process capability, which quality characteristics (Qi) fall within the safe zone. For all those that fall within the safe zone, SPC simply takes them as they are and standardizes the current process conditions (Pi) as they stand. Conversely, if some quality characteristics (Qj) are found not to fall within the safe zone, then one must diagnose separately from the behavior of the Ca value and the Cp value, carrying out the necessary process improvement so as to find new and more rigorous, more effective parameter conditions (Pj) beyond the existing process parameters (Pi), giving product quality (Q) a genuine chance to be transformed.
The process above can be illustrated with a flowchart as follows (see Figure 1), so as to achieve twice the result with half the effort by following the map. (Note 1: the figures below are excerpted from an article by Mr. Chung-Pu Chang.)
3. Following the Map, the Path Opens Up
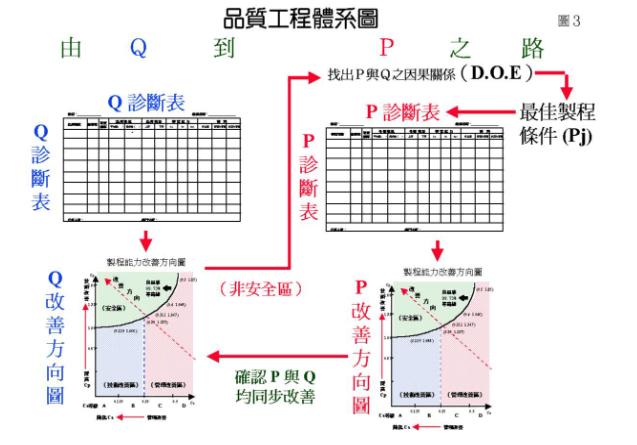
To carry out the quality-diagnosis flowchart described above well, there are two auxiliary tools worth referring to and using. The first one to be used is the “Quality Process Capability Diagnosis Table,” as shown above. This table should list the various quality characteristics that will appear on the product after a specific processing step (for example: gold plating) — such as gold thickness, peel strength, pinholes, and so on. Then, based on recent data, collect 25 or more sets of measurements, calculate the respective values for each quality characteristic, and after taking the specification of that quality characteristic into account, you can separately compute Ca, Cp, and Cpk.
Once you have the process-capability data, you can further plot the Ca/Cp combination on the “Process Capability Improvement Direction Chart,” as shown above. The main dividing line on the “Process Capability Improvement Direction Chart” is the “yield rate XX% contour line.” This contour line can vary by industry and by product. If you adopt the traditional thinking of aiming for ±3 to lie within the upper and lower specification limits, then this yield rate should target 99.73%. As for how to produce 99.73% good products, there is not just one single answer; in fact, it can take various possible combinations depending on technical precision and management capability.
By using the “MIDSPC” statistical software package, you can use the process-capability analysis in the histogram to easily simulate the various Ca/Cp combinations that can produce a 99.73% yield rate. Besides the traditional theoretical combination of Ca=0, Cp=1 yielding 99.73% good products, when Ca=0.125, if Cp can be raised to 1.0667 you can likewise obtain a 99.73% yield rate; and by analogy, combinations such as (0.25, 1.237), (0.4, 1.54607), and (0.5, 1.85) can of course all achieve a 99.73% yield rate. In other words, Ca and Cp are mutually complementary: when Ca grows larger, if Cp rises correspondingly you can naturally still obtain the same yield rate, and vice versa. Simply use the same logic and follow the same pattern.
In recent years, Japanese companies have made very concrete breakthroughs in their efforts to raise the Pj process capability. For example, the process management of chemical solutions has shifted from the traditional batch replacement (Batch Replace) to an Auto Dosing System that monitors concentration in real time and adds chemicals automatically. Likewise, MiDFUN’s new version SPCPLUS also has a new feature that lets you set your own formulas so that the inspection results automatically calculate the amount of each chemical solution to add, achieving the goal of automation.
The examples above are all cases of getting the process parameters (P) right from the very start — that is, what Japan calls source management. Its purpose is to ensure that the final product quality (Q) can be safeguarded early through the prior management of process parameters (P). If this is achieved, SPC is all but settled.
Once the aforementioned SPC can be reasonably executed and managed, the last remaining task is to track whether, after the optimal process parameters (Pj) have stabilized, product quality (Q) has likewise been brought into a more stable state. When this step is accomplished, SPC can be considered fully accomplished. The whole process described above constitutes the road from Q to P.
4. In 2023, Dynamic Adjustment Using Big Data and Automation Is No Longer a Dream
In his renowned book “Inside Intel” (Note 2), Dr. Yu-Cheng Yu, former vice president of Intel, spoke highly of McDonald’s when discussing SPC, and even urged his colleagues to take “Mac-Intel” as the goal of their process efforts. Consider why that was.
Have you not noticed how McDonald’s achieves quality (Q)? Does anyone perform outgoing inspection on the fries after they are cooked? Are any of the fries that pass without outgoing inspection half-raw? Are those fries that taste good yet require no inspection only fried by a senior master? In fact, the answer to every one of the questions above is No, because if you want to taste equally good fries at any branch anywhere in the world, fries cannot be inspected into quality (Q). The only way to make such fries — consistent worldwide and varying by neither person nor place — is SPC. As long as you successfully master all the P’s (fry size, fry moisture content, oil temperature, oil quality, frying time), Q naturally takes care of itself.
From McDonald’s success story, it is easier for us to understand that the SPC road from Q to P is the necessary path to guaranteeing quality, and also the most effort-efficient path to securing an enterprise’s success.
However, in modern factories, with their craft complexity and low-volume, high-variety production, the difficulty of production and quality control is far higher than McDonald’s replicable model — yet there is still something worth learning from the above. The greatest advantage today is that the digitalization and automation of process parameter P has become quite easy. It is only that, in practice, there will be many Pj’s, and the relationship to Qi is also many-to-many. By using modern mathematical models and digital control, scientific quality-control personnel — if they have learned well and even grow on their own according to a factory’s product characteristics, using appropriate tools — can, I believe, greatly increase Taiwanese engineers’ competitiveness in automated control. Because although products keep changing, the main characteristics of a factory’s products and the control under automation must have their own context and patterns. If Taiwanese engineers can seize this opportunity, then under the coming decade’s wave of regionalization and automation they will surely be able to find their own place. Let us strive together!!!
(Note 1) Reference: “On the Major Impact of the ISO-9000 Revision on SPC,” originally published in Quality Control Monthly, Issue 31-2, author: Chung-Pu Chang.
(Note 2) Reference: “My View of Intel,” published by Commonwealth Publishing, author: Yu-Cheng Yu.
Copyright © 2023 MiDFUN Co., Ltd. Some rights reserved
Author: Pei-Chi Chiu. First published: 2023-02-13. Type: Quality Management Column
Original link: https://www.midfun.com.tw/qc/2023_%e6%96%b0%e7%94%b1q%e5%88%b0p%e4%b9%8b%e8%b7%af/
This work is released under the Creative Commons Attribution-NonCommercial-NoDerivatives 4.0 International License (CC BY-NC-ND 4.0). You are welcome to share it freely, provided that you credit the original author, include the original link, make no commercial use, and do not modify the content.
Suggested citation: Chiu, Pei-Chi (2023). “From Q to P: The Road Revisited (2023).” MiDFUN Quality Management Column.
Reprint authorization and content inquiries: midfun@midfun.com.tw